 ISGEC Heavy Engineering Ltd.Обновлено
 ISGEC - Healthy consolidation & Bullish Structure near breakout
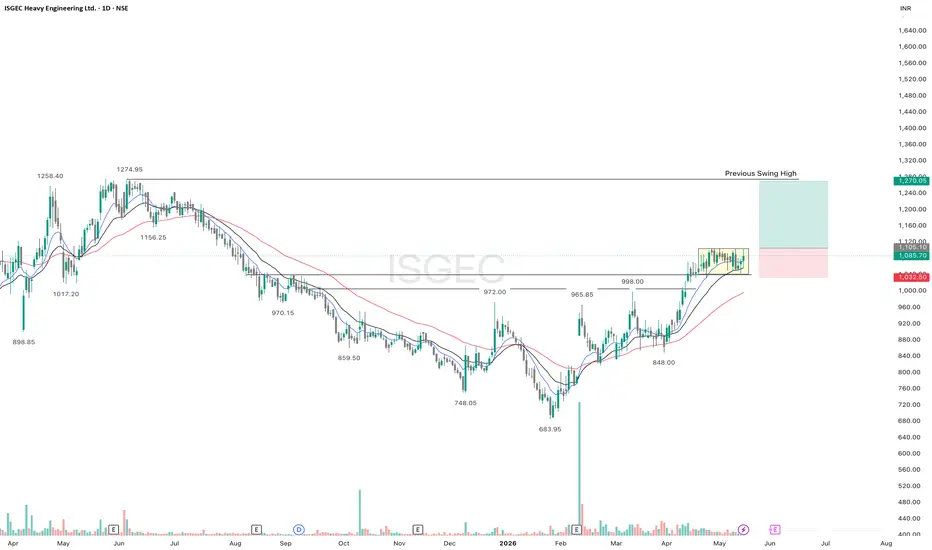
ISGEC is looking strong on the daily timeframe. After making a low near the 684 zone, the stock started forming a bullish reversal structure with continuous higher highs and higher lows.
Recently, price gave a strong move above the important 1000 resistance zone and is now consolidating near 1080-1100 levels. This type of consolidation after a sharp upside move generally indicates strength, as sellers are not able to push price down aggressively.
Another positive sign is that price is sustaining above the key EMAs, and the EMAs are also aligning on the bullish side. Previous resistance around 1030-1050 is now acting as support.
Current structure suggests that buyers are still active in the stock. If price gives a breakout from the current consolidation with strong displacement and volume, then there is probability of an upside move towards the previous swing high zone near 1250-1275 levels.
Important zones to watch:
• Support zone: 1030-1050
• Immediate resistance: 1100 zone
• Major resistance / previous swing high: 1250-1275
As long as price sustains above the recent breakout area and EMAs, bullish structure remains intact.
This is my personal analysis, share your viewpoint.
✅ If you like my analysis, please follow me here as a token of appreciation :)
in.tradingview.com/u/SatpalS/
📌 For learning and educational purposes only, not a recommendation. Please consult your financial advisor before investing.
Recently, price gave a strong move above the important 1000 resistance zone and is now consolidating near 1080-1100 levels. This type of consolidation after a sharp upside move generally indicates strength, as sellers are not able to push price down aggressively.
Another positive sign is that price is sustaining above the key EMAs, and the EMAs are also aligning on the bullish side. Previous resistance around 1030-1050 is now acting as support.
Current structure suggests that buyers are still active in the stock. If price gives a breakout from the current consolidation with strong displacement and volume, then there is probability of an upside move towards the previous swing high zone near 1250-1275 levels.
Important zones to watch:
• Support zone: 1030-1050
• Immediate resistance: 1100 zone
• Major resistance / previous swing high: 1250-1275
As long as price sustains above the recent breakout area and EMAs, bullish structure remains intact.
This is my personal analysis, share your viewpoint.
✅ If you like my analysis, please follow me here as a token of appreciation :)
in.tradingview.com/u/SatpalS/
📌 For learning and educational purposes only, not a recommendation. Please consult your financial advisor before investing.
Сделка закрыта вручную
It didn't give entry.
Похожие публикации
Отказ от ответственности
Информация и публикации не предназначены для предоставления и не являются финансовыми, инвестиционными, торговыми или другими видами советов или рекомендаций, предоставленных или одобренных TradingView. Подробнее читайте в Условиях использования.
Похожие публикации
Отказ от ответственности
Информация и публикации не предназначены для предоставления и не являются финансовыми, инвестиционными, торговыми или другими видами советов или рекомендаций, предоставленных или одобренных TradingView. Подробнее читайте в Условиях использования.