
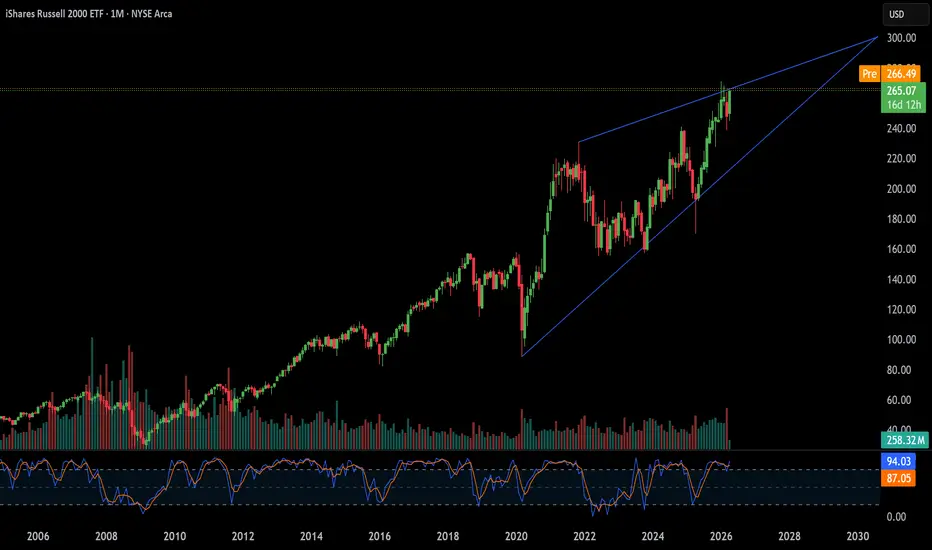
From tariff shockwaves and a $368 billion debt wall to AI reshoring and a patent gold rush, what really drives America's small-cap benchmark.
KEY STATS AT A GLANCE
• –22% Bear Market Low, April 2025
• +12% Q1 2026 Surge
• 18× Forward P/E (vs. S&P 500 at 22×)
• $368B 2026 Small-Cap Debt Maturity Wall
The Russell 2000 has never been a quiet index. But the twelve months spanning April 2025 through April 2026 delivered a volatility sequence so compressed, so multi-causal, and so revealing of structural fault lines that it demands a full forensic accounting. Within a single calendar year, the index entered a bear market, staged a record rebound, flirted with all-time highs, and then corrected sharply, all while the S&P 500 climbed in relative calm. Understanding why requires examining forces far beyond price charts.
This analysis cuts across twelve interconnected domains: geopolitics, geostrategy, industry structure, company culture, business models, management quality, macroeconomics, monetary policy, technology, cybersecurity, science, and patents. Each domain contributed to Russell's turbulence. Together, they reveal the index as a high-sensitivity instrument not merely of small-cap fortunes, but of the entire American economic operating system.
Tariff Shockwaves and the Liberation Day Reckoning
On April 3, 2025, the Russell 2000 plunged 6.6% in a single session, the first major U.S. benchmark to enter bear market territory that cycle. The trigger: the Trump administration's "Liberation Day" sweeping reciprocal tariff rollout. Analysts initially expected small-caps to benefit from protectionist policy, given their domestic revenue orientation. They were wrong.
The catch lay in supply chains. Companies like Victoria's Secret and Urban Outfitters — both Russell 2000 constituents source heavily from abroad. Tariff-driven input cost inflation hit their margins immediately. The index fell nearly 22% from its 52-week high, erasing a post-election surge that had reached 8.6% in a single week after November 2024.
"The revival in small caps expected from the America First agenda turned into a rout for companies whose fortunes are most closely tied to the U.S. economy." Bloomberg, April 3, 2025
By late 2025, however, a "shock and bore" stabilization in trade negotiations shifted the narrative. Tariffs that initially caused panic ultimately incentivized reshoring, the relocation of manufacturing back to American soil. Small-caps, generating roughly 77% of revenues domestically, became the structural winners of that pivot.
Reshoring, the Middle East, and the Domestic Fortress
Geostrategy operates on longer timelines than geopolitics, and its fingerprints on the Russell 2000 are correspondingly deeper. The reshoring movement, accelerated by both tariff policy and pandemic-era supply chain trauma, created a structural tailwind for small-cap industrials, construction firms, and logistics operators that cannot be reversed quickly.
The Middle Eastern conflict simultaneously acted as an unexpected catalyst. Global supply chain disruptions, which battered multinationals dependent on foreign logistics, largely bypassed the domestically anchored Russell 2000 constituents. Companies like Bloom Energy gained relative insulation precisely because their revenue base never left American borders. On March 23, 2026, peace-talk announcements triggered a 10.5% intraday drop in crude oil prices, sparking a 3% single-session surge in the Russell, its largest in over six months.
Near-shoring initiatives, supported by fiscal legislation, reinforced this geostrategic advantage. Infrastructure spending directed at domestic capacity ports, semiconductors, and clean energy disproportionately benefited smaller, regionally focused companies over the mega-cap multinationals that dominate the S&P 500.
The K-Shaped Recovery Within Small Caps
Not all sectors within the Russell 2000 participated equally in the recovery. Biotechnology, industrials, and regional banking led the rebound. Biotech benefited from a pharmaceutical patent cliff that drove large-cap acquirers to hunt for small-cap innovators. Industrial firms rode the reshoring wave. Regional banks, long suppressed by compressed net interest margins, recovered as the yield curve normalized.
On the losing side, debt-laden "zombie" firms, operationally unviable companies that survived only through near-zero interest rates, faced existential pressure. Companies like Atara Biotherapeutics and Aquestive Therapeutics struggled to participate in the rally as investors demanded cash flow positivity, not just revenue growth. The "quality divide" between profitable small-caps and speculative names became the defining investment theme of 2026.
Optical retail and material handling sectors also underperformed. National Vision closed stores and reported operating margins below industry averages. Columbus McKinnon saw flat sales over two years while expenses climbed. These divergences confirm that sector selection within the Russell 2000 carries far more alpha than index-level positioning alone.
Culture as Competitive Moat
In a year defined by margin pressure and debt refinancing anxiety, company culture emerged as an underappreciated differentiator. Small firms with strong innovation cultures and disciplined capital allocation consistently outperformed those that prioritized growth at any cost. Construction Partners, a civil infrastructure firm within the Russell 2000, exemplified this dynamic: organic revenue growth remained steady, but earnings-per-share growth dramatically outpaced revenue, reflecting operational leverage and cultural discipline around cost management.
Analysts increasingly scrutinize leadership communication quality, employee retention metrics, and R&D-to-revenue ratios as leading indicators for small-cap performance. Companies that built cultures of accountability and execution during the high-rate environment emerged stronger. Those that burned capital on undisciplined expansion now face refinancing walls they cannot scale.
Recurring Revenue vs. the Refinancing Wall
The Federal Reserve's prolonged high-rate cycle exposed a lethal vulnerability in the Russell 2000: floating-rate debt. Nearly 40% of Russell 2000 constituents carry floating-rate obligations. When the federal funds rate held near 5.25–5.50%, this cohort faced a compounding capital cost crisis. The $368 billion debt maturity wall arriving in 2026 forced thousands of firms to refinance at rates near 6.5% compared to the 1–2% rates they had locked in during the pandemic era.
Business models built on subscription revenues, long-term contracts, and asset-light operations proved far more resilient. SaaS-adjacent small-caps, specialty insurers with recurring premiums, and infrastructure firms with contracted cash flows traded at significant premiums to peers with transactional or project-based revenue. The market effectively priced business model quality into valuations with unusual precision throughout this cycle.
Goldman Sachs analyst Ben Snider noted that return dispersion within the Russell 2000 exceeds twice that of the S&P 500, making it fertile ground for active alpha generation. The bank projects that changes in fiscal policy, AI adoption, and M&A activity will create unusually large idiosyncratic returns in 2026. This dispersion rewards deep, stock-level research over passive index exposure, a structural argument for active small-cap management at this moment in the cycle.
The CEO Premium in a Turbulent Market
Leadership quality carries an outsized price premium in small-cap markets, where a single executive decision can move the needle materially on a $500 million company. The 2025–2026 cycle validated this asymmetry. Firms led by CEOs who communicated clearly during the tariff shock, maintained liquidity discipline, and articulated credible refinancing strategies retained investor confidence during drawdowns.
Conversely, executives who over-leveraged during the zero-rate era and failed to hedge interest rate exposure destroyed significant shareholder value. The "One Big Beautiful Bill Act" (OBBBA), effective January 1, 2026, introduced 100% bonus depreciation and immediate R&D expensing provisions that reward capital-allocation-savvy leaders who moved quickly to capture the tax incentives. Firms with management teams that had studied and prepared for the OBBBA provisions captured first-mover advantages in fixed asset deployment.
The Fed's Pivot and the Rate Sensitivity Problem
No single variable moved the Russell 2000 more consistently than Federal Reserve policy. The index's disproportionate sensitivity to rate changes driven by that floating-rate debt concentration made it a leveraged proxy for monetary policy expectations. Three consecutive 25-basis-point cuts in late 2025, bringing the federal funds rate to 3.50–3.75%, acted as a financial relief valve for the index's most indebted constituents.
Historical data reinforces this pattern starkly. The Russell 2000 has averaged 36% returns in the 12 months following the final rate cut of a tightening cycle since 1984. The 2025–2026 cycle tracked this pattern closely, with the index posting approximately 12.8% for full-year 2025, modest by historical standards, but with substantial momentum building through Q4. Early 2026 extended that momentum before the March correction.
The "soft landing" macro backdrop, with real GDP growth projected at 2.6% for 2026, inflation gradually normalizing, provides the ideal operating environment for small-cap earnings expansion. Consensus estimates forecast 17–22% EPS growth for Russell 2000 constituents in 2026, more than doubling the 14% projected for the S&P 500.
Valuation Gaps and the Mean-Reversion Case
By late 2025, the valuation gap between the Russell 2000 and the S&P 500 reached a 30-year extreme. Small-caps traded at roughly 16× forward earnings versus 22–23× for large-caps. This historically anomalous discount created what analysts at Goldman Sachs called "upside risk," a compression trade waiting for a catalyst. The Fed's rate cuts provided that catalyst.
As of January 2026, the Russell 2000's forward P/E had expanded to 18.11×, still below the S&P 500 but meaningfully re-rated. This valuation normalization, combined with the EPS growth inflection, creates a dual engine for returns: multiple expansion plus earnings growth. The "Magnificent Seven" mega-caps, by contrast, face the reverse dynamic, rich valuations meeting decelerating AI capital returns.
Consumer resilience underpins the domestic revenue base. Models project consumption growth exceeding 2% year-over-year through 2026. For a Russell 2000 cohort deriving 77% of revenues from U.S. consumers and businesses, this baseline spending strength provides a floor that international-facing multinationals simply cannot claim.
AI as Tailwind, Not Headwind, for Small Caps
The dominant narrative of 2024–2025 framed artificial intelligence as exclusively beneficial to mega-cap technology firms. The reality arriving in 2026 is more nuanced. Large-cap AI leaders now grapple with "AI fatigue," exhausted valuations, massive capital expenditure commitments, and uncertain monetization timelines. Meanwhile, small-cap industrials and specialty manufacturers use AI-driven operational tools as pure cost reduction and margin expansion levers.
Corporate AI adoption within the Russell 2000 accelerated dramatically through 2025. Manufacturers deploying predictive maintenance algorithms cut downtime costs. Regional logistics firms using route optimization AI improved fuel efficiency. Healthcare companies leveraging AI-assisted diagnostics have reduced administrative overhead. For these firms, AI is not a product; it is a productivity multiplier applied to existing businesses, generating immediate returns without the capital intensity of foundation model development.
The OBBBA's immediate R&D expensing provision incentivized this AI integration wave further. Small-cap firms that previously deferred technology investments now accelerate them, creating a technology adoption gap between the Russell 2000 innovators and laggards that will compound into earnings divergence over the next three years.
The Hidden Risk Premium in Small-Cap Security
Cybersecurity represents one of the most underappreciated risk factors embedded in Russell 2000 valuations. Small and mid-sized companies are disproportionately targeted by ransomware and supply chain attacks, yet spend a fraction of what large-caps allocate to security infrastructure. The gap is not trivial: a material cyberattack can erase 15–30% of a small-cap's market capitalization in days, with recovery timelines measured in quarters, not weeks.
Investors who incorporate cybersecurity posture into fundamental analysis gain a risk-adjusted edge. Companies with SOC 2 Type II certification, active incident response plans, and cyber insurance appropriate to their revenue profiles demonstrate operational maturity that correlates with broader management quality. Conversely, firms that treat security as a compliance checkbox rather than a strategic priority carry hidden liability that standard financial metrics fail to capture.
The reshoring trend creates a second cybersecurity dynamic: as more manufacturing and critical infrastructure relocate to U.S. soil, the attack surface for state-sponsored threat actors expands. Small-cap industrials operating in defense-adjacent sectors face nation-state adversaries for the first time, a threat vector their IT teams were never designed to confront.
Biotech, Clean Energy, and the Innovation Pipeline
The Russell 2000's biotech and clean energy cohorts represent its highest-variance, highest-potential segment. Biotech small-caps occupy a unique position: they carry the risk of binary clinical outcomes but benefit from a structural acquisition pipeline driven by large-cap pharmaceutical companies facing patent expirations. The "patent cliff" facing major pharma firms with blockbuster drugs losing exclusivity through 2027 has created M&A urgency that provides a consistent floor under small-cap biotech valuations.
Clean energy small-caps solar installers, battery storage manufacturers, and grid modernization specialists benefit from dual tailwinds: energy security concerns driving domestic infrastructure investment, and the OBBBA's capital expensing provisions accelerating equipment deployment. Companies with defensible technology positions in these sectors attracted strategic acquirers and institutional capital throughout 2025.
High-tech manufacturing small-caps occupy an emerging niche at the intersection of reshoring and advanced fabrication. Defense contractors, precision component manufacturers, and specialized semiconductor suppliers found demand surging as supply chain diversification policies took hold. These firms represent the most durable long-term growth thesis within the Russell 2000 businesses with genuine technological differentiation, domestic manufacturing footprints, and government contract visibility.
Intellectual Property as a Valuation Driver
Patent portfolios have become an increasingly decisive valuation factor for Russell 2000 constituents, particularly in biotech, medtech, and specialty industrial sectors. The large-cap pharmaceutical patent cliff does not merely create M&A demand; it defines acquisition premiums. A small-cap biotech with a clean, well-prosecuted patent estate in a therapeutic area facing large-cap competition commands valuations 30–50% above peers with equivalent revenue but weaker IP defensibility.
Investors now conduct IP due diligence as a standard pre-investment exercise, analyzing patent breadth, claim strength, expiration timelines, and Freedom-to-Operate (FTO) clearances. Companies with continuation patent strategies filing sequential improvements that extend IP protection cycles attract sustained institutional interest. Those with single foundational patents expiring within three years face a different investor calculus entirely.
The OBBBA's immediate R&D expensing provision has the secondary effect of accelerating patent filing activity across the Russell 2000. When companies expense R&D immediately rather than amortizing it, the cash flow benefit incentivizes reinvestment into new IP development. The patent pipeline filling now will shape competitive dynamics and M&A valuations through 2029 and beyond.
"Dispersion within the Russell 2000 indicates particularly fertile ground for alpha generation the index's return dispersion is more than twice that of the S&P 500." Goldman Sachs, Ben Snider, December 2025
What the Russell 2000 Tells Us About America
The Russell 2000's turbulence across 2025–2026 is not noise. It is a signal of a high-resolution readout of the American economy's stress points and growth vectors simultaneously. Tariff policy, rate sensitivity, technology adoption curves, IP development cycles, and geopolitical reshoring all converge in a 2,000-stock universe that captures Main Street America more faithfully than any large-cap index.
The index faces genuine near-term risks: the $368 billion refinancing wall, stubborn inflation in select input categories, and geopolitical re-escalation that could reverse energy price relief. But the structural tailwinds valuation discount versus large-caps, domestic revenue insulation, OBBBA fiscal stimulus, AI-driven productivity gains, and the biotech M&A pipeline represent the strongest fundamental case for small-cap outperformance in a generation.
The quality divide will intensify. Profitable, cash-flow-positive, IP-rich, and well-managed small-caps will diverge from zombie firms at an accelerating rate. Active management and rigorous fundamental analysis spanning geopolitics, technology posture, patent estates, and management quality will separate exceptional returns from index exposure.
For investors willing to do the work, the Russell 2000 in 2026 is not just an index. It is an opportunity set.
KEY STATS AT A GLANCE
• –22% Bear Market Low, April 2025
• +12% Q1 2026 Surge
• 18× Forward P/E (vs. S&P 500 at 22×)
• $368B 2026 Small-Cap Debt Maturity Wall
The Russell 2000 has never been a quiet index. But the twelve months spanning April 2025 through April 2026 delivered a volatility sequence so compressed, so multi-causal, and so revealing of structural fault lines that it demands a full forensic accounting. Within a single calendar year, the index entered a bear market, staged a record rebound, flirted with all-time highs, and then corrected sharply, all while the S&P 500 climbed in relative calm. Understanding why requires examining forces far beyond price charts.
This analysis cuts across twelve interconnected domains: geopolitics, geostrategy, industry structure, company culture, business models, management quality, macroeconomics, monetary policy, technology, cybersecurity, science, and patents. Each domain contributed to Russell's turbulence. Together, they reveal the index as a high-sensitivity instrument not merely of small-cap fortunes, but of the entire American economic operating system.
Tariff Shockwaves and the Liberation Day Reckoning
On April 3, 2025, the Russell 2000 plunged 6.6% in a single session, the first major U.S. benchmark to enter bear market territory that cycle. The trigger: the Trump administration's "Liberation Day" sweeping reciprocal tariff rollout. Analysts initially expected small-caps to benefit from protectionist policy, given their domestic revenue orientation. They were wrong.
The catch lay in supply chains. Companies like Victoria's Secret and Urban Outfitters — both Russell 2000 constituents source heavily from abroad. Tariff-driven input cost inflation hit their margins immediately. The index fell nearly 22% from its 52-week high, erasing a post-election surge that had reached 8.6% in a single week after November 2024.
"The revival in small caps expected from the America First agenda turned into a rout for companies whose fortunes are most closely tied to the U.S. economy." Bloomberg, April 3, 2025
By late 2025, however, a "shock and bore" stabilization in trade negotiations shifted the narrative. Tariffs that initially caused panic ultimately incentivized reshoring, the relocation of manufacturing back to American soil. Small-caps, generating roughly 77% of revenues domestically, became the structural winners of that pivot.
Reshoring, the Middle East, and the Domestic Fortress
Geostrategy operates on longer timelines than geopolitics, and its fingerprints on the Russell 2000 are correspondingly deeper. The reshoring movement, accelerated by both tariff policy and pandemic-era supply chain trauma, created a structural tailwind for small-cap industrials, construction firms, and logistics operators that cannot be reversed quickly.
The Middle Eastern conflict simultaneously acted as an unexpected catalyst. Global supply chain disruptions, which battered multinationals dependent on foreign logistics, largely bypassed the domestically anchored Russell 2000 constituents. Companies like Bloom Energy gained relative insulation precisely because their revenue base never left American borders. On March 23, 2026, peace-talk announcements triggered a 10.5% intraday drop in crude oil prices, sparking a 3% single-session surge in the Russell, its largest in over six months.
Near-shoring initiatives, supported by fiscal legislation, reinforced this geostrategic advantage. Infrastructure spending directed at domestic capacity ports, semiconductors, and clean energy disproportionately benefited smaller, regionally focused companies over the mega-cap multinationals that dominate the S&P 500.
The K-Shaped Recovery Within Small Caps
Not all sectors within the Russell 2000 participated equally in the recovery. Biotechnology, industrials, and regional banking led the rebound. Biotech benefited from a pharmaceutical patent cliff that drove large-cap acquirers to hunt for small-cap innovators. Industrial firms rode the reshoring wave. Regional banks, long suppressed by compressed net interest margins, recovered as the yield curve normalized.
On the losing side, debt-laden "zombie" firms, operationally unviable companies that survived only through near-zero interest rates, faced existential pressure. Companies like Atara Biotherapeutics and Aquestive Therapeutics struggled to participate in the rally as investors demanded cash flow positivity, not just revenue growth. The "quality divide" between profitable small-caps and speculative names became the defining investment theme of 2026.
Optical retail and material handling sectors also underperformed. National Vision closed stores and reported operating margins below industry averages. Columbus McKinnon saw flat sales over two years while expenses climbed. These divergences confirm that sector selection within the Russell 2000 carries far more alpha than index-level positioning alone.
Culture as Competitive Moat
In a year defined by margin pressure and debt refinancing anxiety, company culture emerged as an underappreciated differentiator. Small firms with strong innovation cultures and disciplined capital allocation consistently outperformed those that prioritized growth at any cost. Construction Partners, a civil infrastructure firm within the Russell 2000, exemplified this dynamic: organic revenue growth remained steady, but earnings-per-share growth dramatically outpaced revenue, reflecting operational leverage and cultural discipline around cost management.
Analysts increasingly scrutinize leadership communication quality, employee retention metrics, and R&D-to-revenue ratios as leading indicators for small-cap performance. Companies that built cultures of accountability and execution during the high-rate environment emerged stronger. Those that burned capital on undisciplined expansion now face refinancing walls they cannot scale.
Recurring Revenue vs. the Refinancing Wall
The Federal Reserve's prolonged high-rate cycle exposed a lethal vulnerability in the Russell 2000: floating-rate debt. Nearly 40% of Russell 2000 constituents carry floating-rate obligations. When the federal funds rate held near 5.25–5.50%, this cohort faced a compounding capital cost crisis. The $368 billion debt maturity wall arriving in 2026 forced thousands of firms to refinance at rates near 6.5% compared to the 1–2% rates they had locked in during the pandemic era.
Business models built on subscription revenues, long-term contracts, and asset-light operations proved far more resilient. SaaS-adjacent small-caps, specialty insurers with recurring premiums, and infrastructure firms with contracted cash flows traded at significant premiums to peers with transactional or project-based revenue. The market effectively priced business model quality into valuations with unusual precision throughout this cycle.
Goldman Sachs analyst Ben Snider noted that return dispersion within the Russell 2000 exceeds twice that of the S&P 500, making it fertile ground for active alpha generation. The bank projects that changes in fiscal policy, AI adoption, and M&A activity will create unusually large idiosyncratic returns in 2026. This dispersion rewards deep, stock-level research over passive index exposure, a structural argument for active small-cap management at this moment in the cycle.
The CEO Premium in a Turbulent Market
Leadership quality carries an outsized price premium in small-cap markets, where a single executive decision can move the needle materially on a $500 million company. The 2025–2026 cycle validated this asymmetry. Firms led by CEOs who communicated clearly during the tariff shock, maintained liquidity discipline, and articulated credible refinancing strategies retained investor confidence during drawdowns.
Conversely, executives who over-leveraged during the zero-rate era and failed to hedge interest rate exposure destroyed significant shareholder value. The "One Big Beautiful Bill Act" (OBBBA), effective January 1, 2026, introduced 100% bonus depreciation and immediate R&D expensing provisions that reward capital-allocation-savvy leaders who moved quickly to capture the tax incentives. Firms with management teams that had studied and prepared for the OBBBA provisions captured first-mover advantages in fixed asset deployment.
The Fed's Pivot and the Rate Sensitivity Problem
No single variable moved the Russell 2000 more consistently than Federal Reserve policy. The index's disproportionate sensitivity to rate changes driven by that floating-rate debt concentration made it a leveraged proxy for monetary policy expectations. Three consecutive 25-basis-point cuts in late 2025, bringing the federal funds rate to 3.50–3.75%, acted as a financial relief valve for the index's most indebted constituents.
Historical data reinforces this pattern starkly. The Russell 2000 has averaged 36% returns in the 12 months following the final rate cut of a tightening cycle since 1984. The 2025–2026 cycle tracked this pattern closely, with the index posting approximately 12.8% for full-year 2025, modest by historical standards, but with substantial momentum building through Q4. Early 2026 extended that momentum before the March correction.
The "soft landing" macro backdrop, with real GDP growth projected at 2.6% for 2026, inflation gradually normalizing, provides the ideal operating environment for small-cap earnings expansion. Consensus estimates forecast 17–22% EPS growth for Russell 2000 constituents in 2026, more than doubling the 14% projected for the S&P 500.
Valuation Gaps and the Mean-Reversion Case
By late 2025, the valuation gap between the Russell 2000 and the S&P 500 reached a 30-year extreme. Small-caps traded at roughly 16× forward earnings versus 22–23× for large-caps. This historically anomalous discount created what analysts at Goldman Sachs called "upside risk," a compression trade waiting for a catalyst. The Fed's rate cuts provided that catalyst.
As of January 2026, the Russell 2000's forward P/E had expanded to 18.11×, still below the S&P 500 but meaningfully re-rated. This valuation normalization, combined with the EPS growth inflection, creates a dual engine for returns: multiple expansion plus earnings growth. The "Magnificent Seven" mega-caps, by contrast, face the reverse dynamic, rich valuations meeting decelerating AI capital returns.
Consumer resilience underpins the domestic revenue base. Models project consumption growth exceeding 2% year-over-year through 2026. For a Russell 2000 cohort deriving 77% of revenues from U.S. consumers and businesses, this baseline spending strength provides a floor that international-facing multinationals simply cannot claim.
AI as Tailwind, Not Headwind, for Small Caps
The dominant narrative of 2024–2025 framed artificial intelligence as exclusively beneficial to mega-cap technology firms. The reality arriving in 2026 is more nuanced. Large-cap AI leaders now grapple with "AI fatigue," exhausted valuations, massive capital expenditure commitments, and uncertain monetization timelines. Meanwhile, small-cap industrials and specialty manufacturers use AI-driven operational tools as pure cost reduction and margin expansion levers.
Corporate AI adoption within the Russell 2000 accelerated dramatically through 2025. Manufacturers deploying predictive maintenance algorithms cut downtime costs. Regional logistics firms using route optimization AI improved fuel efficiency. Healthcare companies leveraging AI-assisted diagnostics have reduced administrative overhead. For these firms, AI is not a product; it is a productivity multiplier applied to existing businesses, generating immediate returns without the capital intensity of foundation model development.
The OBBBA's immediate R&D expensing provision incentivized this AI integration wave further. Small-cap firms that previously deferred technology investments now accelerate them, creating a technology adoption gap between the Russell 2000 innovators and laggards that will compound into earnings divergence over the next three years.
The Hidden Risk Premium in Small-Cap Security
Cybersecurity represents one of the most underappreciated risk factors embedded in Russell 2000 valuations. Small and mid-sized companies are disproportionately targeted by ransomware and supply chain attacks, yet spend a fraction of what large-caps allocate to security infrastructure. The gap is not trivial: a material cyberattack can erase 15–30% of a small-cap's market capitalization in days, with recovery timelines measured in quarters, not weeks.
Investors who incorporate cybersecurity posture into fundamental analysis gain a risk-adjusted edge. Companies with SOC 2 Type II certification, active incident response plans, and cyber insurance appropriate to their revenue profiles demonstrate operational maturity that correlates with broader management quality. Conversely, firms that treat security as a compliance checkbox rather than a strategic priority carry hidden liability that standard financial metrics fail to capture.
The reshoring trend creates a second cybersecurity dynamic: as more manufacturing and critical infrastructure relocate to U.S. soil, the attack surface for state-sponsored threat actors expands. Small-cap industrials operating in defense-adjacent sectors face nation-state adversaries for the first time, a threat vector their IT teams were never designed to confront.
Biotech, Clean Energy, and the Innovation Pipeline
The Russell 2000's biotech and clean energy cohorts represent its highest-variance, highest-potential segment. Biotech small-caps occupy a unique position: they carry the risk of binary clinical outcomes but benefit from a structural acquisition pipeline driven by large-cap pharmaceutical companies facing patent expirations. The "patent cliff" facing major pharma firms with blockbuster drugs losing exclusivity through 2027 has created M&A urgency that provides a consistent floor under small-cap biotech valuations.
Clean energy small-caps solar installers, battery storage manufacturers, and grid modernization specialists benefit from dual tailwinds: energy security concerns driving domestic infrastructure investment, and the OBBBA's capital expensing provisions accelerating equipment deployment. Companies with defensible technology positions in these sectors attracted strategic acquirers and institutional capital throughout 2025.
High-tech manufacturing small-caps occupy an emerging niche at the intersection of reshoring and advanced fabrication. Defense contractors, precision component manufacturers, and specialized semiconductor suppliers found demand surging as supply chain diversification policies took hold. These firms represent the most durable long-term growth thesis within the Russell 2000 businesses with genuine technological differentiation, domestic manufacturing footprints, and government contract visibility.
Intellectual Property as a Valuation Driver
Patent portfolios have become an increasingly decisive valuation factor for Russell 2000 constituents, particularly in biotech, medtech, and specialty industrial sectors. The large-cap pharmaceutical patent cliff does not merely create M&A demand; it defines acquisition premiums. A small-cap biotech with a clean, well-prosecuted patent estate in a therapeutic area facing large-cap competition commands valuations 30–50% above peers with equivalent revenue but weaker IP defensibility.
Investors now conduct IP due diligence as a standard pre-investment exercise, analyzing patent breadth, claim strength, expiration timelines, and Freedom-to-Operate (FTO) clearances. Companies with continuation patent strategies filing sequential improvements that extend IP protection cycles attract sustained institutional interest. Those with single foundational patents expiring within three years face a different investor calculus entirely.
The OBBBA's immediate R&D expensing provision has the secondary effect of accelerating patent filing activity across the Russell 2000. When companies expense R&D immediately rather than amortizing it, the cash flow benefit incentivizes reinvestment into new IP development. The patent pipeline filling now will shape competitive dynamics and M&A valuations through 2029 and beyond.
"Dispersion within the Russell 2000 indicates particularly fertile ground for alpha generation the index's return dispersion is more than twice that of the S&P 500." Goldman Sachs, Ben Snider, December 2025
What the Russell 2000 Tells Us About America
The Russell 2000's turbulence across 2025–2026 is not noise. It is a signal of a high-resolution readout of the American economy's stress points and growth vectors simultaneously. Tariff policy, rate sensitivity, technology adoption curves, IP development cycles, and geopolitical reshoring all converge in a 2,000-stock universe that captures Main Street America more faithfully than any large-cap index.
The index faces genuine near-term risks: the $368 billion refinancing wall, stubborn inflation in select input categories, and geopolitical re-escalation that could reverse energy price relief. But the structural tailwinds valuation discount versus large-caps, domestic revenue insulation, OBBBA fiscal stimulus, AI-driven productivity gains, and the biotech M&A pipeline represent the strongest fundamental case for small-cap outperformance in a generation.
The quality divide will intensify. Profitable, cash-flow-positive, IP-rich, and well-managed small-caps will diverge from zombie firms at an accelerating rate. Active management and rigorous fundamental analysis spanning geopolitics, technology posture, patent estates, and management quality will separate exceptional returns from index exposure.
For investors willing to do the work, the Russell 2000 in 2026 is not just an index. It is an opportunity set.

Stock N Roll!
Отказ от ответственности
Информация и публикации не предназначены для предоставления и не являются финансовыми, инвестиционными, торговыми или другими видами советов или рекомендаций, предоставленных или одобренных TradingView. Подробнее читайте в Условиях использования.
Stock N Roll!
Отказ от ответственности
Информация и публикации не предназначены для предоставления и не являются финансовыми, инвестиционными, торговыми или другими видами советов или рекомендаций, предоставленных или одобренных TradingView. Подробнее читайте в Условиях использования.