

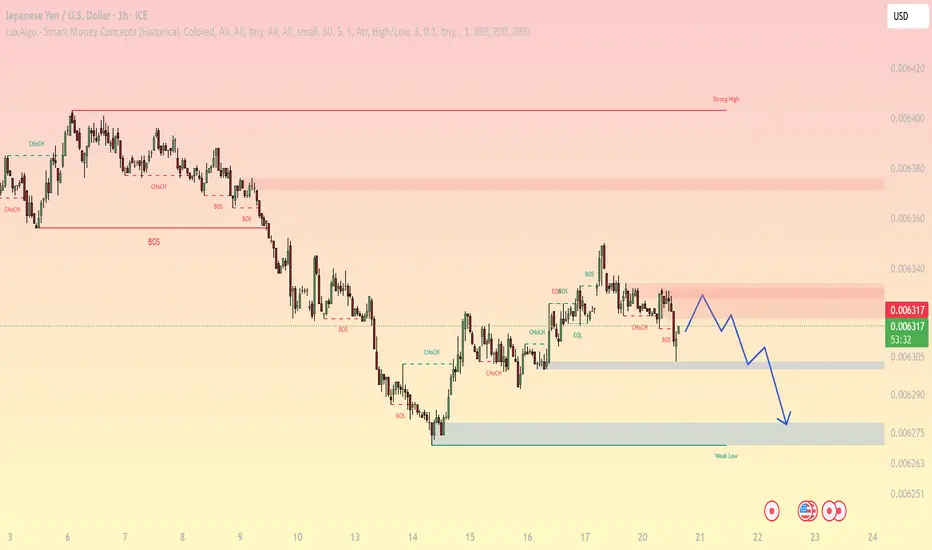
JPYUSD 1H Analysis: Range Breakdown Risk, Bearish Continuation Toward Weak Low
JPYUSD on the 1H chart is shifting into a bearish intraday setup after failing to hold above the mid-range and printing fresh structure weakness near the recent supply zone. Price is now compressing below a key resistance band around 0.00633–0.00634, and the path of least resistance favors a liquidity run into the weak low area.
Current price area on the chart: ~0.006316

Market Structure and Order Flow (SMC Read)
This chart shows a larger selloff (left side) followed by a recovery and then a clear loss of momentum:
The recent bullish leg stalled and formed a distribution-like range.
Multiple structure marks (CHoCH/BOS labels) suggest buyers failed to extend, while sellers defended the premium zone.
Price is now trading below the local swing structure, which typically leads to a sweep of resting liquidity below.
Key idea:
If the market cannot reclaim the supply zone, the next efficient move is a push lower to collect sell-side liquidity under the range.
Key Supply and Demand Zones (Support/Resistance)
Resistance (Sell Zone / Rejection Area)
0.00633–0.00634: overhead supply zone (primary intraday resistance)
0.00637–0.00638: higher resistance band (only relevant if price reclaims strongly)
0.00640: “strong high” liquidity (macro upside magnet, but not the current bias)
Support (Downside Targets)
0.006305: first intraday support shelf (minor demand)
0.006275–0.006263: weak low / major downside liquidity pool (main target zone)
If 0.006305 breaks and holds, probability increases significantly for a drop into 0.006275–0.006263.
Fibonacci Framework (Range-to-Range Projection)
Using the recent swing high near the supply zone (~0.00634) and swing low around (~0.006275), the key retracement levels align with the current structure:
0.382–0.50 area sits inside 0.00632–0.00633 (a typical “reload” zone for sellers)
0.618 aligns closer to the upper supply band (0.00633–0.00634)
This means pullbacks into 0.00632–0.00634 are structurally attractive for short setups while the market is below that band.
Trendline Plan (Simple and Effective)
Draw a descending trendline across the lower highs from the post-peak distribution area. As long as price respects that trendline and fails to close back above the supply zone, the bearish continuation thesis remains intact.
Practical filter:
Bearish bias holds if 1H closes keep printing below 0.00633–0.00634.
Bias weakens if price accepts above 0.00634 and turns the zone into support.
RSI Confirmation (Timing, Not Prediction)
On 1H RSI:
Bearish continuation is favored while RSI stays below 50 and fails on retests.
If RSI shows bullish divergence near 0.006275–0.006263, that is a strong signal to take profit on shorts and look for a bounce (not necessarily a full reversal).
High-Probability Intraday Trading Strategies
Strategy A: Sell the Pullback Into Supply (Best Risk/Reward)
Wait for a pullback into 0.00632–0.00634
Entry trigger: bearish rejection candle or 1H close back below 0.00632 after tapping supply
Stop-loss:
Conservative: above 0.00634
Safer: above 0.00638 (if volatility is high)
Take-profit plan:
TP1: 0.006305
TP2: 0.006290
TP3: 0.006275–0.006263 (main liquidity target)
This setup aligns with market efficiency: sell premium, target weak low liquidity.
Strategy B: Breakdown Continuation (Momentum Short)
Require a clean 1H close below 0.006305
Wait for a retest of 0.006305–0.006310 (avoid chasing the breakdown)
Stop-loss: above the retest high
Targets: 0.006290 → 0.006275–0.006263
This approach avoids false breaks and forces the market to confirm acceptance lower.
Strategy C: Bullish Invalidations (When Shorts Stop Working)
Only switch to bullish if:
Price reclaims and holds above 0.00634, then retests it as support.
In that case, upside magnets become 0.00637–0.00638 and potentially 0.00640.
Intraday Bias Summary
Bearish below 0.00633–0.00634
Main downside target: 0.006275–0.006263
Key pivot: 0.006305 (break and hold = acceleration lower)
Bullish scenario only activates on acceptance above 0.00634
JPYUSD on the 1H chart is shifting into a bearish intraday setup after failing to hold above the mid-range and printing fresh structure weakness near the recent supply zone. Price is now compressing below a key resistance band around 0.00633–0.00634, and the path of least resistance favors a liquidity run into the weak low area.
Current price area on the chart: ~0.006316
Market Structure and Order Flow (SMC Read)
This chart shows a larger selloff (left side) followed by a recovery and then a clear loss of momentum:
The recent bullish leg stalled and formed a distribution-like range.
Multiple structure marks (CHoCH/BOS labels) suggest buyers failed to extend, while sellers defended the premium zone.
Price is now trading below the local swing structure, which typically leads to a sweep of resting liquidity below.
Key idea:
If the market cannot reclaim the supply zone, the next efficient move is a push lower to collect sell-side liquidity under the range.
Key Supply and Demand Zones (Support/Resistance)
Resistance (Sell Zone / Rejection Area)
0.00633–0.00634: overhead supply zone (primary intraday resistance)
0.00637–0.00638: higher resistance band (only relevant if price reclaims strongly)
0.00640: “strong high” liquidity (macro upside magnet, but not the current bias)
Support (Downside Targets)
0.006305: first intraday support shelf (minor demand)
0.006275–0.006263: weak low / major downside liquidity pool (main target zone)
If 0.006305 breaks and holds, probability increases significantly for a drop into 0.006275–0.006263.
Fibonacci Framework (Range-to-Range Projection)
Using the recent swing high near the supply zone (~0.00634) and swing low around (~0.006275), the key retracement levels align with the current structure:
0.382–0.50 area sits inside 0.00632–0.00633 (a typical “reload” zone for sellers)
0.618 aligns closer to the upper supply band (0.00633–0.00634)
This means pullbacks into 0.00632–0.00634 are structurally attractive for short setups while the market is below that band.
Trendline Plan (Simple and Effective)
Draw a descending trendline across the lower highs from the post-peak distribution area. As long as price respects that trendline and fails to close back above the supply zone, the bearish continuation thesis remains intact.
Practical filter:
Bearish bias holds if 1H closes keep printing below 0.00633–0.00634.
Bias weakens if price accepts above 0.00634 and turns the zone into support.
RSI Confirmation (Timing, Not Prediction)
On 1H RSI:
Bearish continuation is favored while RSI stays below 50 and fails on retests.
If RSI shows bullish divergence near 0.006275–0.006263, that is a strong signal to take profit on shorts and look for a bounce (not necessarily a full reversal).
High-Probability Intraday Trading Strategies
Strategy A: Sell the Pullback Into Supply (Best Risk/Reward)
Wait for a pullback into 0.00632–0.00634
Entry trigger: bearish rejection candle or 1H close back below 0.00632 after tapping supply
Stop-loss:
Conservative: above 0.00634
Safer: above 0.00638 (if volatility is high)
Take-profit plan:
TP1: 0.006305
TP2: 0.006290
TP3: 0.006275–0.006263 (main liquidity target)
This setup aligns with market efficiency: sell premium, target weak low liquidity.
Strategy B: Breakdown Continuation (Momentum Short)
Require a clean 1H close below 0.006305
Wait for a retest of 0.006305–0.006310 (avoid chasing the breakdown)
Stop-loss: above the retest high
Targets: 0.006290 → 0.006275–0.006263
This approach avoids false breaks and forces the market to confirm acceptance lower.
Strategy C: Bullish Invalidations (When Shorts Stop Working)
Only switch to bullish if:
Price reclaims and holds above 0.00634, then retests it as support.
In that case, upside magnets become 0.00637–0.00638 and potentially 0.00640.
Intraday Bias Summary
Bearish below 0.00633–0.00634
Main downside target: 0.006275–0.006263
Key pivot: 0.006305 (break and hold = acceleration lower)
Bullish scenario only activates on acceptance above 0.00634

🪙 JOIN OUR FREE TELEGRAM GROUP 🪙
t.me/dnaprofits
Join the community group to get support and share knowledge!
️🥇 Exchange and learn market knowledge
️🥇 Support free trading signals
t.me/dnaprofits
Join the community group to get support and share knowledge!
️🥇 Exchange and learn market knowledge
️🥇 Support free trading signals
Отказ от ответственности
Информация и публикации не предназначены для предоставления и не являются финансовыми, инвестиционными, торговыми или другими видами советов или рекомендаций, предоставленных или одобренных TradingView. Подробнее читайте в Условиях использования.
🪙 JOIN OUR FREE TELEGRAM GROUP 🪙
t.me/dnaprofits
Join the community group to get support and share knowledge!
️🥇 Exchange and learn market knowledge
️🥇 Support free trading signals
t.me/dnaprofits
Join the community group to get support and share knowledge!
️🥇 Exchange and learn market knowledge
️🥇 Support free trading signals
Отказ от ответственности
Информация и публикации не предназначены для предоставления и не являются финансовыми, инвестиционными, торговыми или другими видами советов или рекомендаций, предоставленных или одобренных TradingView. Подробнее читайте в Условиях использования.