
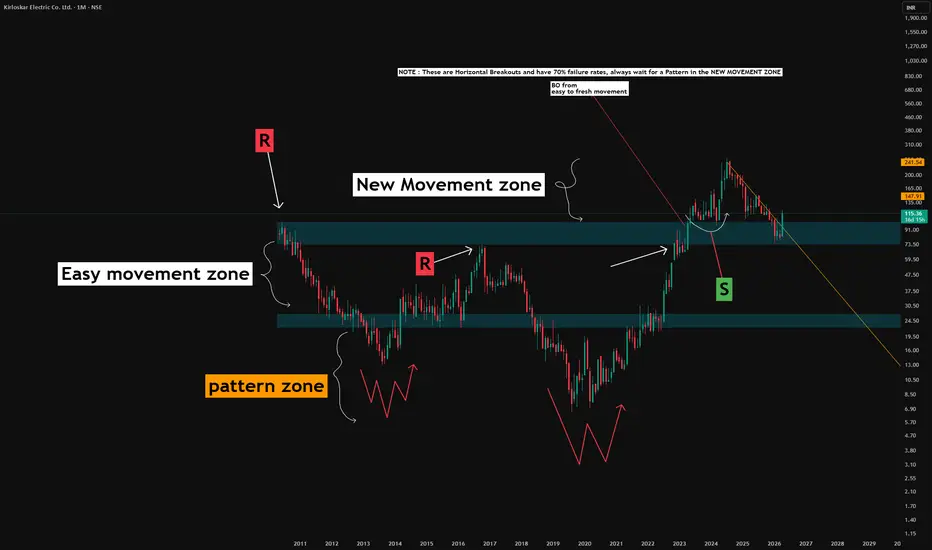
📊 Understanding the Three-Zone Framework | Structure Over Speculation
Markets don't move randomly — they move in structure. This chart breaks down a three-zone framework designed to help traders read price action more systematically, without relying on predictions or bias.
📌 Zone 1 — The Pattern Zone (Base of the Chart)
This is where price tends to spend considerable time building foundational structure. Classic patterns like Inverse Head & Shoulders or Double Bottoms are commonly observed here. These patterns are significant not because of what they "predict," but because of what they reveal — that the market is absorbing selling pressure and compressing energy.
The Pattern Zone typically sits within a demand area, which adds a layer of confluence to any structure forming here. A breakout from this zone is worth monitoring, but only in the context of what comes next.
📌 Zone 2 — The Easy Movement Zone (Between S and R)
Once price exits the Pattern Zone, it enters what I call the Easy Movement Zone — the range between a clearly defined Support (S) and Resistance (R). 📈
The reason this zone earns its name is simple: the path from S to R within this band tends to be clean and one-directional. There are fewer obstacles, fewer structural conflicts, and historically, price has shown a tendency to travel through this range with relatively low noise. For traders who caught the breakout from the Pattern Zone, this zone represents a straightforward ride — not because the outcome is guaranteed, but because the context is clear.
📌 Zone 3 — The New Movement Zone (Above Resistance)
This is where things get significantly more complex — and where most retail traders make critical errors. ⚠️
When price breaks out of the Easy Movement Zone and enters the New Movement Zone, it is now in uncharted or historically thin price territory. These types of breakouts — often referred to as multi-year breakouts — carry a well-documented risk: horizontal multi-year breakout levels have an approximately 70% failure rate.
That means the majority of traders who enter immediately on these breakouts are exposed to fakeouts and traps. Patience here is not a weakness — it is the strategy.
🔑 What to Watch for in the New Movement Zone
Rather than chasing price into new territory, the disciplined approach involves two key observations:
Resistance-to-Support Conversion — Watch whether the former Resistance (R) level begins acting as Support. This flip is the first meaningful sign that the breakout has structural backing.
Counter Trendline + Pattern Formation — A counter trendline (marked in yellow on the chart) will often form as price consolidates within the New Movement Zone. When a recognizable pattern develops along or near this trendline, it provides a higher-quality entry framework — one rooted in structure, not excitement.
📋⚠️
"The content shared in this post is purely for educational purposes and is intended to illustrate market structure concepts only. Nothing here constitutes financial advice, a trade recommendation, or a directional forecast of any kind — always conduct your own research and consult a qualified financial advisor before making any trading decisions."
Markets don't move randomly — they move in structure. This chart breaks down a three-zone framework designed to help traders read price action more systematically, without relying on predictions or bias.
📌 Zone 1 — The Pattern Zone (Base of the Chart)
This is where price tends to spend considerable time building foundational structure. Classic patterns like Inverse Head & Shoulders or Double Bottoms are commonly observed here. These patterns are significant not because of what they "predict," but because of what they reveal — that the market is absorbing selling pressure and compressing energy.
The Pattern Zone typically sits within a demand area, which adds a layer of confluence to any structure forming here. A breakout from this zone is worth monitoring, but only in the context of what comes next.
📌 Zone 2 — The Easy Movement Zone (Between S and R)
Once price exits the Pattern Zone, it enters what I call the Easy Movement Zone — the range between a clearly defined Support (S) and Resistance (R). 📈
The reason this zone earns its name is simple: the path from S to R within this band tends to be clean and one-directional. There are fewer obstacles, fewer structural conflicts, and historically, price has shown a tendency to travel through this range with relatively low noise. For traders who caught the breakout from the Pattern Zone, this zone represents a straightforward ride — not because the outcome is guaranteed, but because the context is clear.
📌 Zone 3 — The New Movement Zone (Above Resistance)
This is where things get significantly more complex — and where most retail traders make critical errors. ⚠️
When price breaks out of the Easy Movement Zone and enters the New Movement Zone, it is now in uncharted or historically thin price territory. These types of breakouts — often referred to as multi-year breakouts — carry a well-documented risk: horizontal multi-year breakout levels have an approximately 70% failure rate.
That means the majority of traders who enter immediately on these breakouts are exposed to fakeouts and traps. Patience here is not a weakness — it is the strategy.
🔑 What to Watch for in the New Movement Zone
Rather than chasing price into new territory, the disciplined approach involves two key observations:
Resistance-to-Support Conversion — Watch whether the former Resistance (R) level begins acting as Support. This flip is the first meaningful sign that the breakout has structural backing.
Counter Trendline + Pattern Formation — A counter trendline (marked in yellow on the chart) will often form as price consolidates within the New Movement Zone. When a recognizable pattern develops along or near this trendline, it provides a higher-quality entry framework — one rooted in structure, not excitement.
📋⚠️
"The content shared in this post is purely for educational purposes and is intended to illustrate market structure concepts only. Nothing here constitutes financial advice, a trade recommendation, or a directional forecast of any kind — always conduct your own research and consult a qualified financial advisor before making any trading decisions."

📊Swing & positional equity research with Buy, Sell and Hold recommendations.
Contact
📞WhatsApp: wa.me/919455664601
💬Telegram DM: t.me/Apoorv_HH
📢Join Telegram channel: t.me/hashtaghammer
Apoorv Dubey|SEBI RA INH000030287
Contact
📞WhatsApp: wa.me/919455664601
💬Telegram DM: t.me/Apoorv_HH
📢Join Telegram channel: t.me/hashtaghammer
Apoorv Dubey|SEBI RA INH000030287
Похожие публикации
Отказ от ответственности
Информация и публикации не предназначены для предоставления и не являются финансовыми, инвестиционными, торговыми или другими видами советов или рекомендаций, предоставленных или одобренных TradingView. Подробнее читайте в Условиях использования.
📊Swing & positional equity research with Buy, Sell and Hold recommendations.
Contact
📞WhatsApp: wa.me/919455664601
💬Telegram DM: t.me/Apoorv_HH
📢Join Telegram channel: t.me/hashtaghammer
Apoorv Dubey|SEBI RA INH000030287
Contact
📞WhatsApp: wa.me/919455664601
💬Telegram DM: t.me/Apoorv_HH
📢Join Telegram channel: t.me/hashtaghammer
Apoorv Dubey|SEBI RA INH000030287
Похожие публикации
Отказ от ответственности
Информация и публикации не предназначены для предоставления и не являются финансовыми, инвестиционными, торговыми или другими видами советов или рекомендаций, предоставленных или одобренных TradingView. Подробнее читайте в Условиях использования.