Обновлено
Upcoming action?
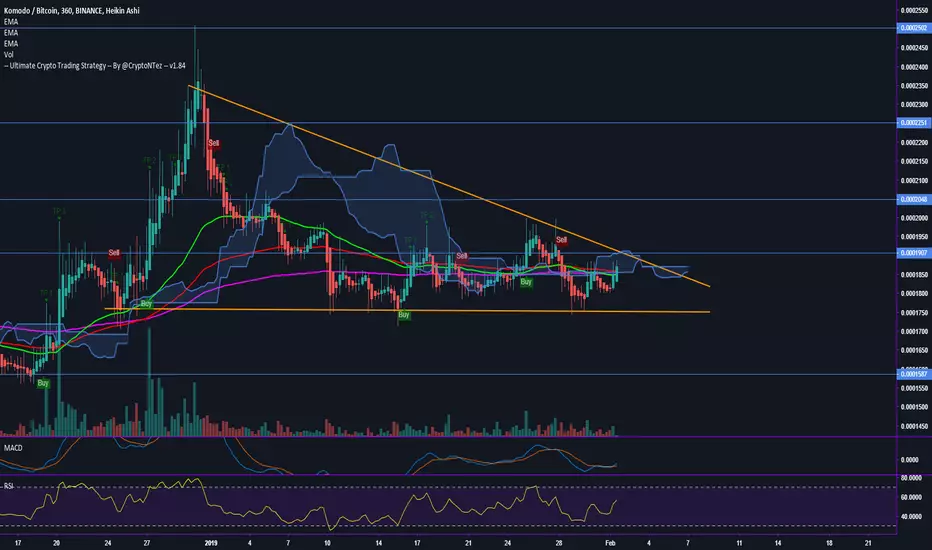
We may see some action in the following days Currently showing a structure that looks like a descending triangle but upcoming events turn me to think that this will break to the upside.
MACD bullcross and RSI rising, EMA50-100-200 almost all together #KMD
Targets both to the upside and downside are on the chart. The alert from the UCTS bring me to this chart since a buy signal is flashing time to time, that is one way that the tool can help you to filter noise from markets and check only that charts where something is happening
MACD bullcross and RSI rising, EMA50-100-200 almost all together #KMD
Targets both to the upside and downside are on the chart. The alert from the UCTS bring me to this chart since a buy signal is flashing time to time, that is one way that the tool can help you to filter noise from markets and check only that charts where something is happening
Сделка закрыта вручную
Update on  KMD, All targets met. I will close my position here. Hope you got the 30%+ profit too!. #KMD Happy trading!

Отказ от ответственности
Информация и публикации не предназначены для предоставления и не являются финансовыми, инвестиционными, торговыми или другими видами советов или рекомендаций, предоставленных или одобренных TradingView. Подробнее читайте в Условиях использования.
Отказ от ответственности
Информация и публикации не предназначены для предоставления и не являются финансовыми, инвестиционными, торговыми или другими видами советов или рекомендаций, предоставленных или одобренных TradingView. Подробнее читайте в Условиях использования.