
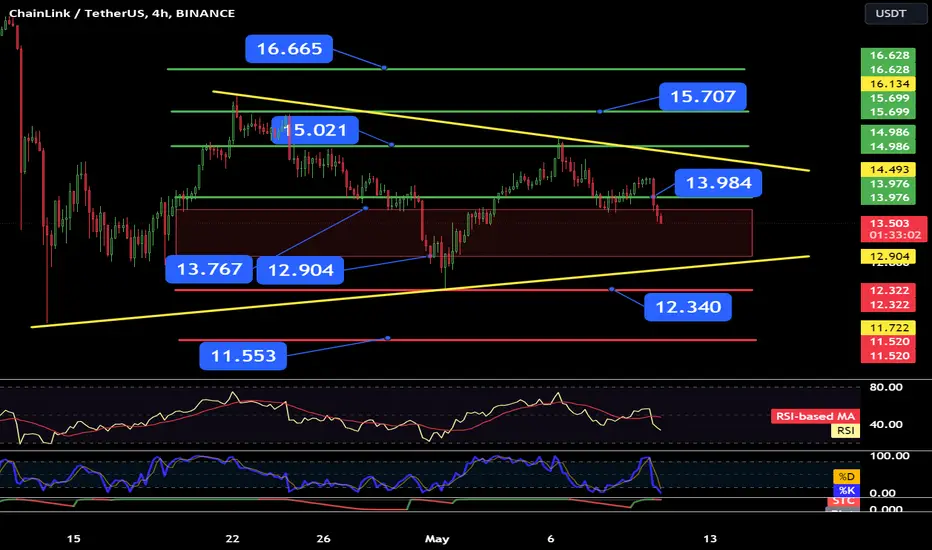
Hello everyone, let's take a look at the LINK to USDT chart on a 4-hour time frame. As you can see, the price is moving above the local uptrend line.
Let's start by determining support and, as you can see, first we have a support zone from $13.77 to $12.90, then we have visible support at $12.34 and then the third support at $11.55.
Now let's move on to the resistance lines, as you can see the first resistance is at $13.98, if you manage to break it, the next resistance will be at $15.02, $15.71 and the fourth resistance at $16.67.
The RSI indicator and the STOCH indicator are approaching the lower limit, which may slow down the current correction, which will keep the price in the support zone.
Let's start by determining support and, as you can see, first we have a support zone from $13.77 to $12.90, then we have visible support at $12.34 and then the third support at $11.55.
Now let's move on to the resistance lines, as you can see the first resistance is at $13.98, if you manage to break it, the next resistance will be at $15.02, $15.71 and the fourth resistance at $16.67.
The RSI indicator and the STOCH indicator are approaching the lower limit, which may slow down the current correction, which will keep the price in the support zone.

Отказ от ответственности
Информация и публикации не предназначены для предоставления и не являются финансовыми, инвестиционными, торговыми или другими видами советов или рекомендаций, предоставленных или одобренных TradingView. Подробнее читайте в Условиях использования.
Отказ от ответственности
Информация и публикации не предназначены для предоставления и не являются финансовыми, инвестиционными, торговыми или другими видами советов или рекомендаций, предоставленных или одобренных TradingView. Подробнее читайте в Условиях использования.