
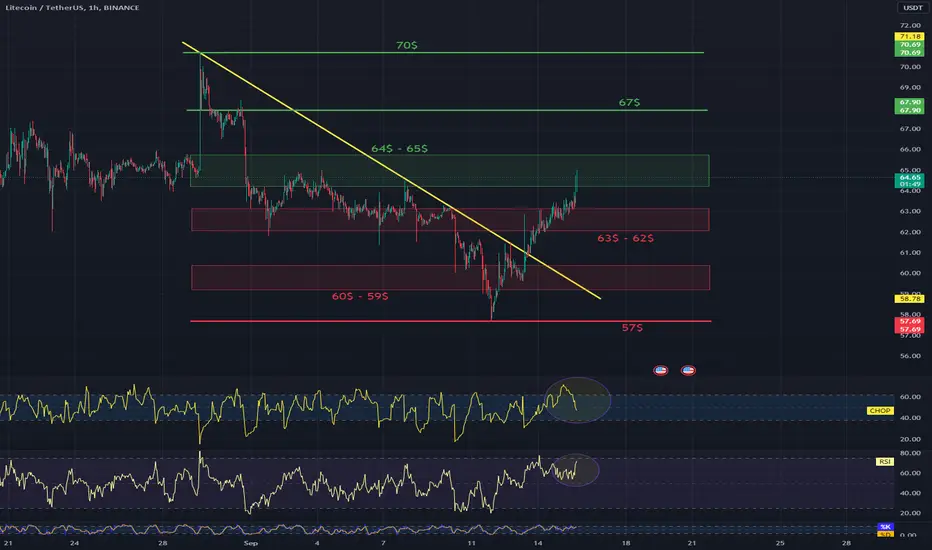
Hello everyone, let's take a look at the LTC to USDT chart on a one hour time frame. As you can see, the price is moving above the local downtrend line.
After unfolding the Fib Retracement grid, we can determine a support zone from $63 to $62, then we have a second zone from $60 to $59, and then strong support at the price of $57.
Looking the other way, we see that the price is struggling with the resistance zone from $64 to $65, then we have resistance at $67, and then strong resistance at $70.
Looking at the CHOP indicator, we see that there is still some energy to continue the upward movement, while the RSI indicator is approaching the upper limit, but we also have some room to go higher.

Отказ от ответственности
Информация и публикации не предназначены для предоставления и не являются финансовыми, инвестиционными, торговыми или другими видами советов или рекомендаций, предоставленных или одобренных TradingView. Подробнее читайте в Условиях использования.
Отказ от ответственности
Информация и публикации не предназначены для предоставления и не являются финансовыми, инвестиционными, торговыми или другими видами советов или рекомендаций, предоставленных или одобренных TradingView. Подробнее читайте в Условиях использования.