
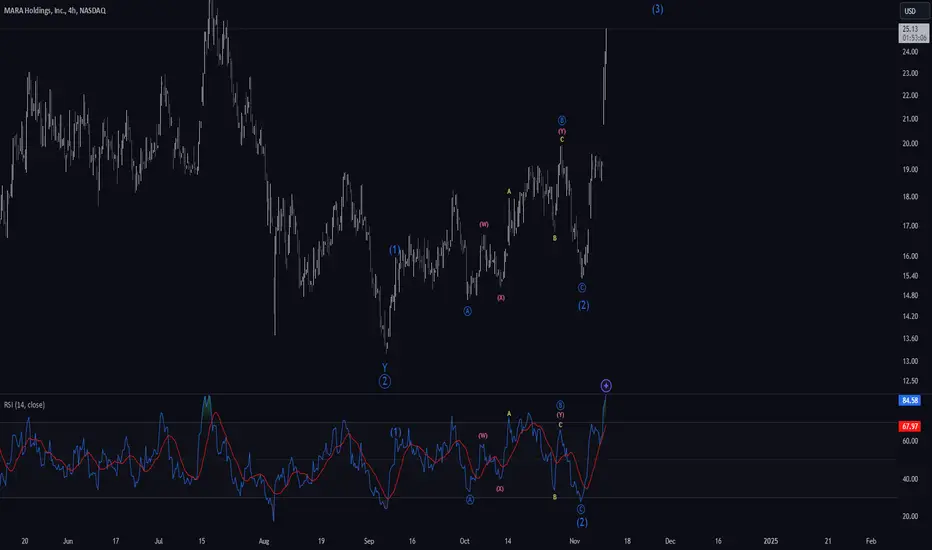
MARA chart showing some very complex Elliott-Wave structures.
Not easy to count, but in combination with the RSI, the structure is very clear.
Beautiful chart in my eyes!
The move to the upside, labeled here as the blue Wave (b) with the pink (wxy) substructure, initially appears to be a 5-wave impulsive move. However, upon closer inspection, and aligning the chart pattern with the RSI, it becomes clear that this is a (wxy) corrective structure rather than an impulse.
Not easy to count, but in combination with the RSI, the structure is very clear.
Beautiful chart in my eyes!
The move to the upside, labeled here as the blue Wave (b) with the pink (wxy) substructure, initially appears to be a 5-wave impulsive move. However, upon closer inspection, and aligning the chart pattern with the RSI, it becomes clear that this is a (wxy) corrective structure rather than an impulse.

Похожие публикации
Отказ от ответственности
Информация и публикации не предназначены для предоставления и не являются финансовыми, инвестиционными, торговыми или другими видами советов или рекомендаций, предоставленных или одобренных TradingView. Подробнее читайте в Условиях использования.
Похожие публикации
Отказ от ответственности
Информация и публикации не предназначены для предоставления и не являются финансовыми, инвестиционными, торговыми или другими видами советов или рекомендаций, предоставленных или одобренных TradingView. Подробнее читайте в Условиях использования.