A New Trendline Break in  META, With a Double Bottom Next to It
There are two things I love in this chart, and they are happening at the same time.
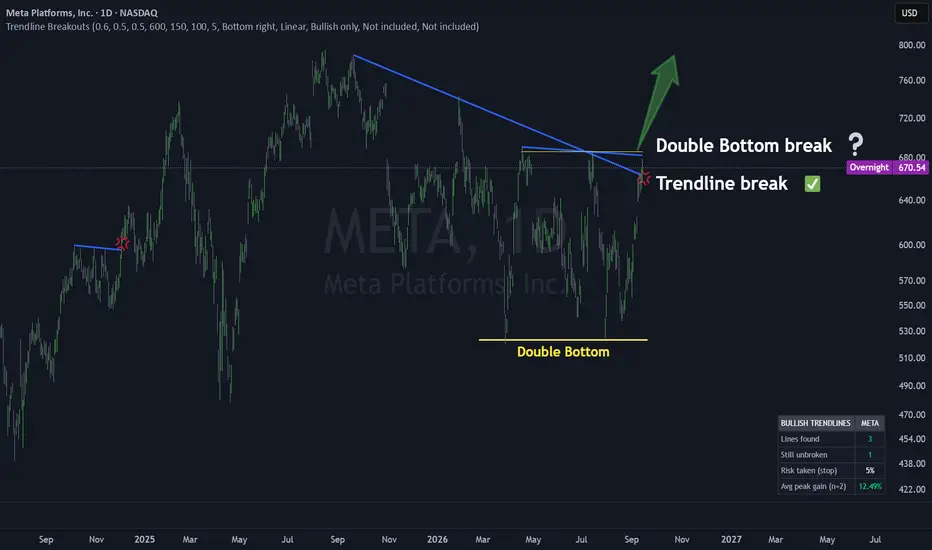
The first is the blue line. Since last autumn, every rally in META stopped there. Buyers pushed, sellers were waiting, price turned back. On Monday, price closed above the Trendline.
A trendline is a queue of sellers. Each time price touched the line, someone in the queue sold. On Monday the queue ran out and that's a short term bull signal.
The second thing is the shape under the line. Two lows at about the same level, a bounce in the middle. A double bottom. The neckline is the yellow line near $688. Price is sitting right under it.
Why I care about Monday
Most days on a chart are noise. The day a trendline breaks is not a normal day. When a line like this one gives way, the next weeks are, on average, much better than the weeks that follow any random day. How much better, with the sample size and the bad cases, is in a study I will publish soon here.
To properly find trendlines and avoid drawing trendlines with different criteria everyday, I built the indicator you see here. It finds these lines by itself and marks the break. No drawing, no opinion.
It already happened once on this chart
Scroll left to late 2025. META broke a trendline of the same kind. What followed was a rally of about 20%. One example proves nothing. But it shows you what the setup looks like when it works.
The Chart
The level I watch next is the yellow line near $688. If price closes above it, the double bottom is complete and the two signals agree. Above that, the last area where sellers showed up in size is near $800. That is a reference, not a target. Below, the blue line is now the level that has to hold.
The full trendline statistics are shared on my profile.
META, With a Double Bottom Next to ItThere are two things I love in this chart, and they are happening at the same time.
The first is the blue line. Since last autumn, every rally in META stopped there. Buyers pushed, sellers were waiting, price turned back. On Monday, price closed above the Trendline.
A trendline is a queue of sellers. Each time price touched the line, someone in the queue sold. On Monday the queue ran out and that's a short term bull signal.
The second thing is the shape under the line. Two lows at about the same level, a bounce in the middle. A double bottom. The neckline is the yellow line near $688. Price is sitting right under it.
Why I care about Monday
Most days on a chart are noise. The day a trendline breaks is not a normal day. When a line like this one gives way, the next weeks are, on average, much better than the weeks that follow any random day. How much better, with the sample size and the bad cases, is in a study I will publish soon here.
To properly find trendlines and avoid drawing trendlines with different criteria everyday, I built the indicator you see here. It finds these lines by itself and marks the break. No drawing, no opinion.
It already happened once on this chart
Scroll left to late 2025. META broke a trendline of the same kind. What followed was a rally of about 20%. One example proves nothing. But it shows you what the setup looks like when it works.
The Chart
The level I watch next is the yellow line near $688. If price closes above it, the double bottom is complete and the two signals agree. Above that, the last area where sellers showed up in size is near $800. That is a reference, not a target. Below, the blue line is now the level that has to hold.
The full trendline statistics are shared on my profile.

Most days the market gives you nothing worth playing.
A few times a month it hands you two aces ♠️♦️.
I tell you when that happens & why, after studying more than 8 million patterns across 30 years.
👉topchartpatterns.substack.com/embed
A few times a month it hands you two aces ♠️♦️.
I tell you when that happens & why, after studying more than 8 million patterns across 30 years.
👉topchartpatterns.substack.com/embed
Похожие публикации
Отказ от ответственности
Информация и публикации не предназначены для предоставления и не являются финансовыми, инвестиционными, торговыми или другими видами советов или рекомендаций, предоставленных или одобренных TradingView. Подробнее читайте в Условиях использования.
Most days the market gives you nothing worth playing.
A few times a month it hands you two aces ♠️♦️.
I tell you when that happens & why, after studying more than 8 million patterns across 30 years.
👉topchartpatterns.substack.com/embed
A few times a month it hands you two aces ♠️♦️.
I tell you when that happens & why, after studying more than 8 million patterns across 30 years.
👉topchartpatterns.substack.com/embed
Похожие публикации
Отказ от ответственности
Информация и публикации не предназначены для предоставления и не являются финансовыми, инвестиционными, торговыми или другими видами советов или рекомендаций, предоставленных или одобренных TradingView. Подробнее читайте в Условиях использования.