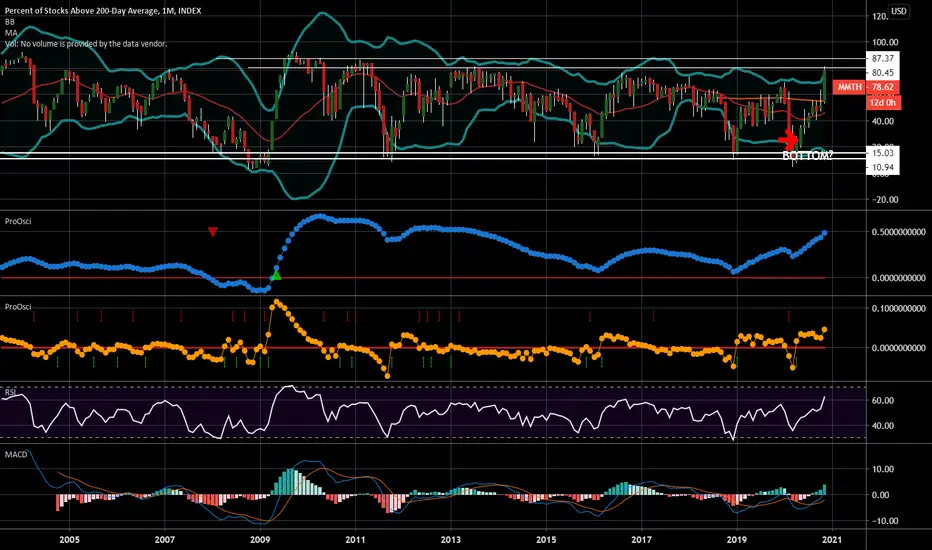
This chart is the monthly chart of % of stocks above their 200 Day Moving Average and when it gets to these levels the market will reverse direction. Greed is at extreme and the RISK greatly outweighs the potential return on a portfolio. Now would be the time to tighten up stop losses, reduce positions or outright sell positions as the market is vulnerable to bad news and could collapse quickly.

Отказ от ответственности
Информация и публикации не предназначены для предоставления и не являются финансовыми, инвестиционными, торговыми или другими видами советов или рекомендаций, предоставленных или одобренных TradingView. Подробнее читайте в Условиях использования.
Отказ от ответственности
Информация и публикации не предназначены для предоставления и не являются финансовыми, инвестиционными, торговыми или другими видами советов или рекомендаций, предоставленных или одобренных TradingView. Подробнее читайте в Условиях использования.