
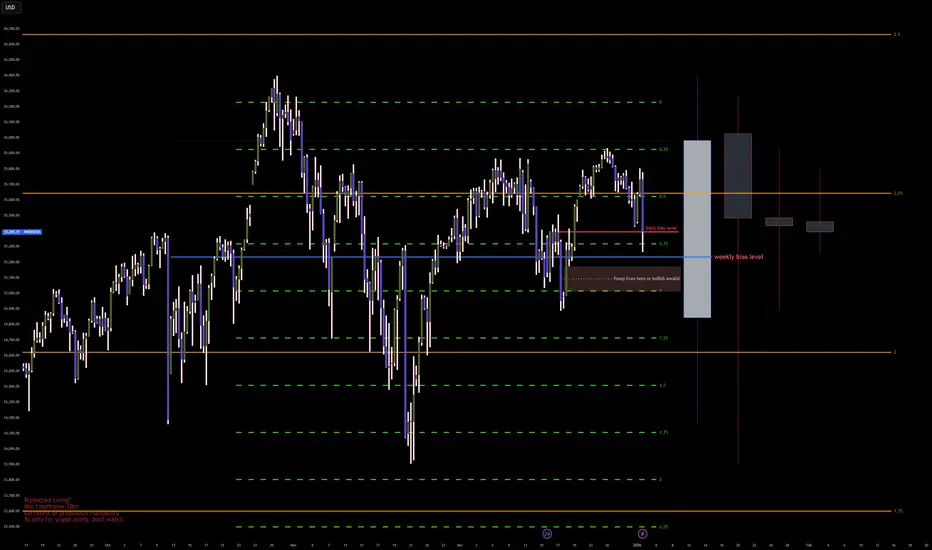
The algorithm is currently engineering a Market Maker Buy Model to reprice towards the Buy Side Liquidity resting at 25900. The present action within the Sunday Open and Monday session is the final accumulation phase at the Weekly Bias Level before the primary expansion leg targets the premium Volume Imbalance.
Entry: 25325.00 (68 points lower)
Stop loss: 25125.00 (200 points from entry)
Take profit: 25925.00 (600 points from entry)
Risk to reward ratio: 3.00R
The absolute truth at the center of this chart is that the algorithm has transitioned from a rebalancing phase into a high probability expansion state targeting the external range liquidity.
You are witnessing a fractal expansion where the Monthly and Weekly order flow is unilaterally bullish and seeking new all time highs.
The Draw on Liquidity for the Month is the parabolic projection target at 26750 which acts as the ultimate magnetic draw for the institutional order flow.
The Draw on Liquidity for the Week is the distinct cluster of Buy Side Liquidity resting above the relative equal highs at 25900.
The Draw on Liquidity for the Day is the internal Volume Imbalance and Void residing between 25600 and 25700 which must be filled before the higher timeframe expansion can complete.
The market has spent the previous sessions consolidating around the 25300 level which is functioning as the dynamic fulcrum for this move.
This consolidation is not indecision it is the engineering of liquidity to fuel the next leg higher.
The entry logic is predicated on the mitigation of the Bullish Order Block and Breaker structure formed around the 25300 region.
The algorithm has successfully displaced above this level and is now holding it as a floor.
We are looking for a subtle retracement or a stop hunt into this 25300 to 25325 pocket during the London or New York Killzone.
This price point represents the equilibrium of the local range and the launchpad for the attack on the highs.
Buying here aligns with the institutional intent to defend the trend and forces you to act when the retail mind is fearful of a reversal.
The temporal window for this entry is the opening range of the week where the initial balance is established before the true expansion begins.
The invalidation of this thesis occurs if the algorithm achieves a daily close below the 25125 swing low.
Such a move would violate the immediate bullish market structure and suggest that the consolidation at 25300 was distribution rather than accumulation.
It would indicate that the algorithm is seeking a deeper discount potentially targeting the 24200 level before any resumption of the uptrend.
If price trades heavy through 25125 with displacement the probability of the bullish expansion collapses and we enter a defensive posture.
Until that structural damage occurs every tick lower is an inducement to trap shorts.
Target 1: 25600.00 | Type: Internal BSL / Void Fill | Probability: 90% | ETA: Monday Tuesday
Target 2: 25925.00 | Type: External BSL / Swing Highs | Probability: 75% | ETA: Mid Week Expansion
Target 3: 26750.00 | Type: Monthly Projection / Discovery | Probability: 60% | ETA: End of Month
A 25% probability exists for the antithetical reality: a Complex Correction.
In this scenario the rejection from the 26000 region was significant enough to warrant a return to the mean of the larger range.
The current holding of 25300 is a trap to induce early longs before a violent flush to the 24500 Order Block.
This reality is confirmed if price breaches the Omega Point at 25100.
Entry: 25325.00 (68 points lower)
Stop loss: 25125.00 (200 points from entry)
Take profit: 25925.00 (600 points from entry)
Risk to reward ratio: 3.00R
The absolute truth at the center of this chart is that the algorithm has transitioned from a rebalancing phase into a high probability expansion state targeting the external range liquidity.
You are witnessing a fractal expansion where the Monthly and Weekly order flow is unilaterally bullish and seeking new all time highs.
The Draw on Liquidity for the Month is the parabolic projection target at 26750 which acts as the ultimate magnetic draw for the institutional order flow.
The Draw on Liquidity for the Week is the distinct cluster of Buy Side Liquidity resting above the relative equal highs at 25900.
The Draw on Liquidity for the Day is the internal Volume Imbalance and Void residing between 25600 and 25700 which must be filled before the higher timeframe expansion can complete.
The market has spent the previous sessions consolidating around the 25300 level which is functioning as the dynamic fulcrum for this move.
This consolidation is not indecision it is the engineering of liquidity to fuel the next leg higher.
The entry logic is predicated on the mitigation of the Bullish Order Block and Breaker structure formed around the 25300 region.
The algorithm has successfully displaced above this level and is now holding it as a floor.
We are looking for a subtle retracement or a stop hunt into this 25300 to 25325 pocket during the London or New York Killzone.
This price point represents the equilibrium of the local range and the launchpad for the attack on the highs.
Buying here aligns with the institutional intent to defend the trend and forces you to act when the retail mind is fearful of a reversal.
The temporal window for this entry is the opening range of the week where the initial balance is established before the true expansion begins.
The invalidation of this thesis occurs if the algorithm achieves a daily close below the 25125 swing low.
Such a move would violate the immediate bullish market structure and suggest that the consolidation at 25300 was distribution rather than accumulation.
It would indicate that the algorithm is seeking a deeper discount potentially targeting the 24200 level before any resumption of the uptrend.
If price trades heavy through 25125 with displacement the probability of the bullish expansion collapses and we enter a defensive posture.
Until that structural damage occurs every tick lower is an inducement to trap shorts.
Target 1: 25600.00 | Type: Internal BSL / Void Fill | Probability: 90% | ETA: Monday Tuesday
Target 2: 25925.00 | Type: External BSL / Swing Highs | Probability: 75% | ETA: Mid Week Expansion
Target 3: 26750.00 | Type: Monthly Projection / Discovery | Probability: 60% | ETA: End of Month
A 25% probability exists for the antithetical reality: a Complex Correction.
In this scenario the rejection from the 26000 region was significant enough to warrant a return to the mean of the larger range.
The current holding of 25300 is a trap to induce early longs before a violent flush to the 24500 Order Block.
This reality is confirmed if price breaches the Omega Point at 25100.
Сделка активна
How much precision do seek from your trades?Is this precise enough?

Telegram: t.me/tradeconfirmed
Похожие публикации
Отказ от ответственности
Информация и публикации не предназначены для предоставления и не являются финансовыми, инвестиционными, торговыми или другими видами советов или рекомендаций, предоставленных или одобренных TradingView. Подробнее читайте в Условиях использования.
Telegram: t.me/tradeconfirmed
Похожие публикации
Отказ от ответственности
Информация и публикации не предназначены для предоставления и не являются финансовыми, инвестиционными, торговыми или другими видами советов или рекомендаций, предоставленных или одобренных TradingView. Подробнее читайте в Условиях использования.