Длинная
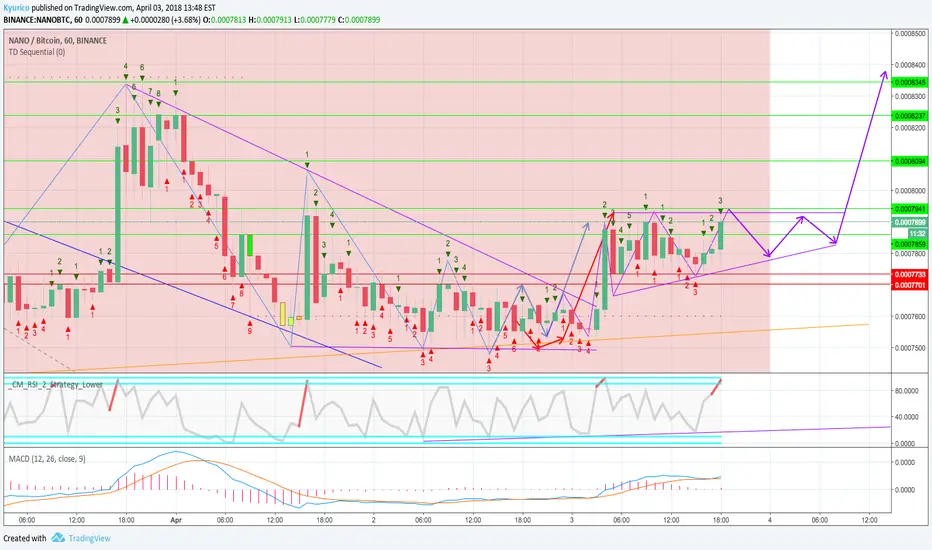
NANO/BTC - Ascending Triangle Formation
Hello! I'm a new trader here who barely knows how to make charts and analyses. I'm Kyurico, and here is MY idea.
Disclaimer: I am not a professional trader and analyzer and would not advise you to trade my ideas unless you are willing to risk some of your BTC. This idea is only to inform others of a possible analysis and trend.
Today, we are taking a look at NANO/BTC.
Strong coin, strong team, and it definitely has momentum!
Here, we have a coin that broke out again after a previous breakout. This breakout that put NANO out of the downtrend, and it now in the uptrend. This allows us to find an entry point that will give us the most profit without doing any bit of trading.
This coin had a breakout out of its bullish descending triangle as expected (that it formed over the course of two days).
You can now see that NANO is positive in its MACD and is in the overbought side of the RSI. Do not let spikes to the downside scare your investments unless it is clear that it is going into the downtrend once again.
It was a decent profit for anyone that noticed it. Now that it retraced a bit after that breakout, it looks to me that it is forming a bullish ascending triangle. NANO is making higher lows and the highs are going to be roughly the same.
I believe it is going to trade in that pattern that I drew for at least 12 more hours before another breakout to make a higher high (previously set at 0.0083)
I would buy in NANO when it touches the bottom the ascending triangle, and sell it again, when it breaks out, or touches (or almost touches) the top of the ascending triangle.
-Kyurico
Disclaimer: I am not a professional trader and analyzer and would not advise you to trade my ideas unless you are willing to risk some of your BTC. This idea is only to inform others of a possible analysis and trend.
Today, we are taking a look at NANO/BTC.
Strong coin, strong team, and it definitely has momentum!
Here, we have a coin that broke out again after a previous breakout. This breakout that put NANO out of the downtrend, and it now in the uptrend. This allows us to find an entry point that will give us the most profit without doing any bit of trading.
This coin had a breakout out of its bullish descending triangle as expected (that it formed over the course of two days).
You can now see that NANO is positive in its MACD and is in the overbought side of the RSI. Do not let spikes to the downside scare your investments unless it is clear that it is going into the downtrend once again.
It was a decent profit for anyone that noticed it. Now that it retraced a bit after that breakout, it looks to me that it is forming a bullish ascending triangle. NANO is making higher lows and the highs are going to be roughly the same.
I believe it is going to trade in that pattern that I drew for at least 12 more hours before another breakout to make a higher high (previously set at 0.0083)
I would buy in NANO when it touches the bottom the ascending triangle, and sell it again, when it breaks out, or touches (or almost touches) the top of the ascending triangle.
-Kyurico
Заметка
Early breakout?...Заметка
The target that we want to reach is 0.00085Заметка
Updated Idea...Заметка
Updated on projected pathЗаметка
It's a good time to lock in so profits while you can and buy back later... there should be a retrace in the next hour or so.Заметка
Заметка
NANO fell way too much due to the massive increase and drop in BTC, we will wait until something happens to NANOЗаметка
NANO should trade between the lines drawn in purple. Failure to breakout would mean more downside for NANO.
Заметка
Predicted movement for NANOЗаметка
Looks like a small, but bullish descending triangle has formed over NANOЗаметка
The bigger picture looks like a large bear flag, with a drop waiting to happen... I would be careful with this nowСделка закрыта: достигнута стоп-лосс цена
NANO looks like it has fallen...
Отказ от ответственности
Информация и публикации не предназначены для предоставления и не являются финансовыми, инвестиционными, торговыми или другими видами советов или рекомендаций, предоставленных или одобренных TradingView. Подробнее читайте в Условиях использования.
Отказ от ответственности
Информация и публикации не предназначены для предоставления и не являются финансовыми, инвестиционными, торговыми или другими видами советов или рекомендаций, предоставленных или одобренных TradingView. Подробнее читайте в Условиях использования.