
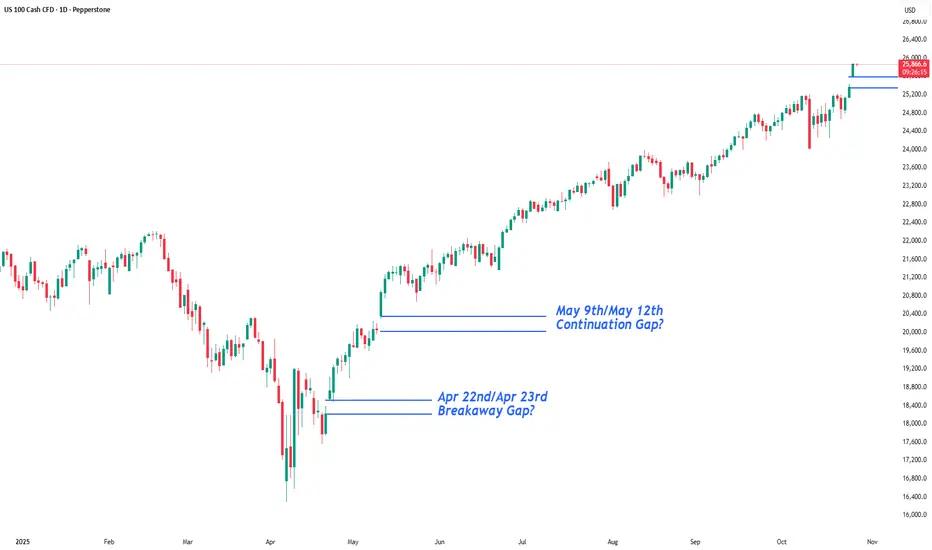
Fresh optimism regarding the potential for a US-China trade deal saw the US 100 rise to a new record high of 25889 early this morning, a daily gain of 2% and an unbelievable rise of 58% from its April 6th low at 16324 when trade tensions were at their height.
Now, across the rest of this week, US 100 traders may be focused on several key events to decide the next directional moves for the index. These are, the Federal Reserve (Fed) interest rate decision, earnings from five of the Magnificent Seven corporates, and the face-to-face meeting between US President Trump and Chinese President Xi. Let’s briefly discuss each one.
On Wednesday at 1800 GMT the Fed are fully expected to cut interest rates 25bps (0.25%) when they release the outcome from their 2-day policy meeting (FOMC). What is less certain is what comes next. Markets are still pricing in a high probability of another 25bps cut at the Fed’s next meeting in December, however any indication that this may not be a sure thing could lead to a more negative outcome for the US 100. The comments made by Fed Chairman Powell in the press conference, which starts at 1830 GMT, could be crucial in this regard.
Once the Fed press conference ends on Wednesday, traders may be absorbed by the release of earnings from Alphabet, Microsoft and Meta, which are followed by the updates from Amazon and Apple after the market close on Thursday. Remember, it wasn’t that long ago that worries about an AI bubble negatively impacted the US 100, and so the focus in these results could be on AI spending, future revenue growth and costs.
The final event is the face-to-face meeting between President’s Trump and Xi which takes place in South Korea on Thursday, the first in 6 years. Current expectations are for the heads of the world’s two biggest economies to agree a series of deals on rare earth metals, soybeans, shipping levies and export controls. Whether these agreements match up to expectations could be pivotal to the direction of the US 100 into the weekend.
Technical Update: Mind The Gaps!
CFD price activity typically forms in relatively smooth patterns, rising in uptrends or falling in downtrends. While brief corrections may occur, they’re often limited in scope and duration before the prevailing trend resumes, unless a shift in sentiment triggers a directional reversal.
Occasionally, within an orderly price advance or decline, acceleration phases emerge, which can result in gaps in price activity. These gaps occur when a CFD closes one session and then opens higher in an uptrend or lower in a downtrend the next day, reflecting a surge in trader interest in the direction of the prevailing trend.
Within technical analysis, there are three types of price gaps, each offering insight into trader sentiment and directional risk. Below is a brief overview of each.
Breakaway Gap: Typically seen at the start of a new trend, this gap reflects strong trader conviction, buyers are willing to pay higher prices at the open in an uptrend, or sellers accept lower prices in a downtrend. It can often be seen to complete a reversal pattern and signals a possible shift in sentiment.

Continuation Gap: Forming within an established trend, this gap can confirm ongoing sentiment, buyers continue to pay higher prices in an uptrend, or sellers accept lower prices in a downtrend. It reinforces confidence in the prevailing move.

Exhaustion Gap: Found in mature trends, this gap reflects late-stage trader entry at already overextended levels, reflecting poor timing, as most of the move has already occurred. It may signal panic buying or selling, with positioning then heavily skewed in the direction of the prevailing trend.

When positioning becomes overly one-sided, with no buyers left in an uptrend or sellers in a downtrend, price can be most vulnerable to a sentiment reversal, often triggering corrective moves.
US 100 Index: Watching the Gaps
The eagle-eyed among you will have noticed that the charts used to illustrate gap concepts above feature the activity of the US 100 Index, which since the April 7th low, is possibly a good example of these gaps in price action.

The latest gap, formed between last Friday’s close and Monday’s open, is labelled as both a possible continuation and exhaustion gap, as it’s unclear at present what this move currently represents. It could signal a continuation of the uptrend from the April lows, or mark an exhaustion point, raising the risk of a sentiment reversal.
Monitoring future price action may help determine whether the latest gap reflects continuation of the uptrend or signals exhaustion, suggesting the risk of price weakness.
If Latest Activity Proves to be a Continuation Gap
If the gap from Friday’s 25374 close is a continuation gap, it could signal a further phase of price strength. This would imply that if price action holds above 23474, upside momentum may still be evident.

If the US 100 Index holds above support at 25374 it may then go on to challenge the next resistance at 25937, which is the 61.8% Fibonacci extension. A break above this level might even open the path toward 26393, which is the 100% extension.
If Latest Activity Proves to be an Exhaustion Gap
If the latest gap activity reflects exhaustion, with positioning skewed too far to the long side, it may lead to a phase of price weakness following the recent advance. A closing break below 25374 could build on these themes and even suggest possibilities of a more extended phase of price weakness.
A move below 25374 could signal fading buying support, suggesting a shift toward lower levels. If evident, downside risks may extend to 25079, which is the 38.2% Fibonacci retracement, potentially even toward 24668, a level marking the 61.8% retracement.
The material provided here has not been prepared accordance with legal requirements designed to promote the independence of investment research and as such is considered to be a marketing communication. Whilst it is not subject to any prohibition on dealing ahead of the dissemination of investment research, we will not seek to take any advantage before providing it to our clients.
Pepperstone doesn’t represent that the material provided here is accurate, current or complete, and therefore shouldn’t be relied upon as such. The information, whether from a third party or not, isn’t to be considered as a recommendation; or an offer to buy or sell; or the solicitation of an offer to buy or sell any security, financial product or instrument; or to participate in any particular trading strategy. It does not take into account readers’ financial situation or investment objectives. We advise any readers of this content to seek their own advice. Without the approval of Pepperstone, reproduction or redistribution of this information isn’t permitted.
Now, across the rest of this week, US 100 traders may be focused on several key events to decide the next directional moves for the index. These are, the Federal Reserve (Fed) interest rate decision, earnings from five of the Magnificent Seven corporates, and the face-to-face meeting between US President Trump and Chinese President Xi. Let’s briefly discuss each one.
On Wednesday at 1800 GMT the Fed are fully expected to cut interest rates 25bps (0.25%) when they release the outcome from their 2-day policy meeting (FOMC). What is less certain is what comes next. Markets are still pricing in a high probability of another 25bps cut at the Fed’s next meeting in December, however any indication that this may not be a sure thing could lead to a more negative outcome for the US 100. The comments made by Fed Chairman Powell in the press conference, which starts at 1830 GMT, could be crucial in this regard.
Once the Fed press conference ends on Wednesday, traders may be absorbed by the release of earnings from Alphabet, Microsoft and Meta, which are followed by the updates from Amazon and Apple after the market close on Thursday. Remember, it wasn’t that long ago that worries about an AI bubble negatively impacted the US 100, and so the focus in these results could be on AI spending, future revenue growth and costs.
The final event is the face-to-face meeting between President’s Trump and Xi which takes place in South Korea on Thursday, the first in 6 years. Current expectations are for the heads of the world’s two biggest economies to agree a series of deals on rare earth metals, soybeans, shipping levies and export controls. Whether these agreements match up to expectations could be pivotal to the direction of the US 100 into the weekend.
Technical Update: Mind The Gaps!
CFD price activity typically forms in relatively smooth patterns, rising in uptrends or falling in downtrends. While brief corrections may occur, they’re often limited in scope and duration before the prevailing trend resumes, unless a shift in sentiment triggers a directional reversal.
Occasionally, within an orderly price advance or decline, acceleration phases emerge, which can result in gaps in price activity. These gaps occur when a CFD closes one session and then opens higher in an uptrend or lower in a downtrend the next day, reflecting a surge in trader interest in the direction of the prevailing trend.
Within technical analysis, there are three types of price gaps, each offering insight into trader sentiment and directional risk. Below is a brief overview of each.
Breakaway Gap: Typically seen at the start of a new trend, this gap reflects strong trader conviction, buyers are willing to pay higher prices at the open in an uptrend, or sellers accept lower prices in a downtrend. It can often be seen to complete a reversal pattern and signals a possible shift in sentiment.
Continuation Gap: Forming within an established trend, this gap can confirm ongoing sentiment, buyers continue to pay higher prices in an uptrend, or sellers accept lower prices in a downtrend. It reinforces confidence in the prevailing move.
Exhaustion Gap: Found in mature trends, this gap reflects late-stage trader entry at already overextended levels, reflecting poor timing, as most of the move has already occurred. It may signal panic buying or selling, with positioning then heavily skewed in the direction of the prevailing trend.
When positioning becomes overly one-sided, with no buyers left in an uptrend or sellers in a downtrend, price can be most vulnerable to a sentiment reversal, often triggering corrective moves.
US 100 Index: Watching the Gaps
The eagle-eyed among you will have noticed that the charts used to illustrate gap concepts above feature the activity of the US 100 Index, which since the April 7th low, is possibly a good example of these gaps in price action.
The latest gap, formed between last Friday’s close and Monday’s open, is labelled as both a possible continuation and exhaustion gap, as it’s unclear at present what this move currently represents. It could signal a continuation of the uptrend from the April lows, or mark an exhaustion point, raising the risk of a sentiment reversal.
Monitoring future price action may help determine whether the latest gap reflects continuation of the uptrend or signals exhaustion, suggesting the risk of price weakness.
If Latest Activity Proves to be a Continuation Gap
If the gap from Friday’s 25374 close is a continuation gap, it could signal a further phase of price strength. This would imply that if price action holds above 23474, upside momentum may still be evident.
If the US 100 Index holds above support at 25374 it may then go on to challenge the next resistance at 25937, which is the 61.8% Fibonacci extension. A break above this level might even open the path toward 26393, which is the 100% extension.
If Latest Activity Proves to be an Exhaustion Gap
If the latest gap activity reflects exhaustion, with positioning skewed too far to the long side, it may lead to a phase of price weakness following the recent advance. A closing break below 25374 could build on these themes and even suggest possibilities of a more extended phase of price weakness.
A move below 25374 could signal fading buying support, suggesting a shift toward lower levels. If evident, downside risks may extend to 25079, which is the 38.2% Fibonacci retracement, potentially even toward 24668, a level marking the 61.8% retracement.
The material provided here has not been prepared accordance with legal requirements designed to promote the independence of investment research and as such is considered to be a marketing communication. Whilst it is not subject to any prohibition on dealing ahead of the dissemination of investment research, we will not seek to take any advantage before providing it to our clients.
Pepperstone doesn’t represent that the material provided here is accurate, current or complete, and therefore shouldn’t be relied upon as such. The information, whether from a third party or not, isn’t to be considered as a recommendation; or an offer to buy or sell; or the solicitation of an offer to buy or sell any security, financial product or instrument; or to participate in any particular trading strategy. It does not take into account readers’ financial situation or investment objectives. We advise any readers of this content to seek their own advice. Without the approval of Pepperstone, reproduction or redistribution of this information isn’t permitted.

Global risk Warning CFDs are complex instruments and come with a high risk of losing money rapidly due to leverage. Between 74-89% of retail investor accounts lose money when trading in CFDs. You should consider whether you understand how CFD
Отказ от ответственности
Информация и публикации не предназначены для предоставления и не являются финансовыми, инвестиционными, торговыми или другими видами советов или рекомендаций, предоставленных или одобренных TradingView. Подробнее читайте в Условиях использования.
Global risk Warning CFDs are complex instruments and come with a high risk of losing money rapidly due to leverage. Between 74-89% of retail investor accounts lose money when trading in CFDs. You should consider whether you understand how CFD
Отказ от ответственности
Информация и публикации не предназначены для предоставления и не являются финансовыми, инвестиционными, торговыми или другими видами советов или рекомендаций, предоставленных или одобренных TradingView. Подробнее читайте в Условиях использования.