
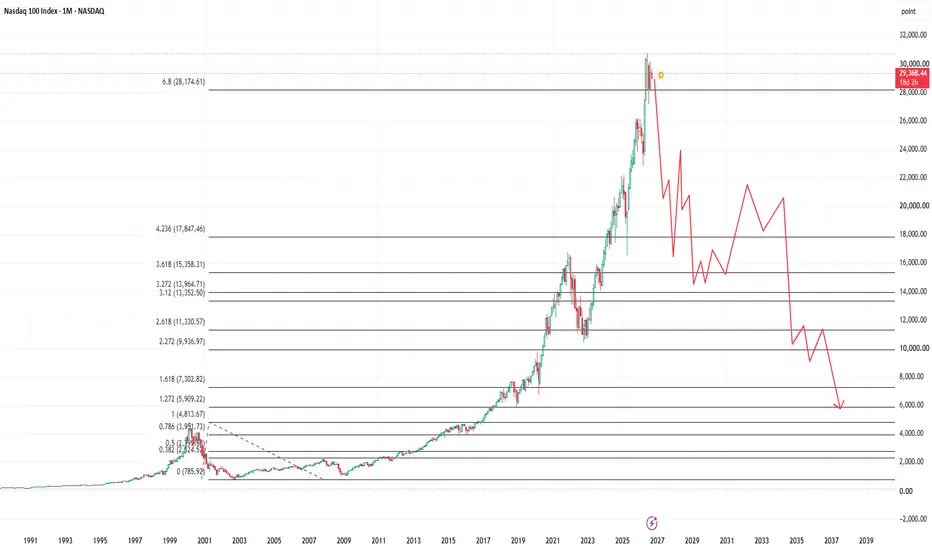
If you draw a fib from the high to the low of the 2000 Nasdaq crash you have the following;
2018 - 2019 Vol Panic = Traded 1.61 to 1.27.
2020 Covid Panic = Traded 2.20 - 1.61.
2022 Inflation Panic = Traded 3.60 - 2.61
2025 War Panic - Sharp retest of 4.23.
That means these fibs have bookended almost every major event in the last decade.
Now we are at the 6.8, which is a critical trend decision.
If this fails as support, we can see minimum of a 40% drop and significantly more if next supports break.
Conversely, if the 6.8 is used as support (or we fake out under it), an exceptional bull move would be likely to follow.
We are at the 6.8 extension of a 80% drop in an index. Where we have traded in a range for close to 6 months.
This is the first time that's happened in your lifetime.
Will probably never happen again in your lifetime.
2018 - 2019 Vol Panic = Traded 1.61 to 1.27.
2020 Covid Panic = Traded 2.20 - 1.61.
2022 Inflation Panic = Traded 3.60 - 2.61
2025 War Panic - Sharp retest of 4.23.
That means these fibs have bookended almost every major event in the last decade.
Now we are at the 6.8, which is a critical trend decision.
If this fails as support, we can see minimum of a 40% drop and significantly more if next supports break.
Conversely, if the 6.8 is used as support (or we fake out under it), an exceptional bull move would be likely to follow.
We are at the 6.8 extension of a 80% drop in an index. Where we have traded in a range for close to 6 months.
This is the first time that's happened in your lifetime.
Will probably never happen again in your lifetime.
Сделка активна
The only other instance of this in history was the 29 extensions, which was the 87 top. 
Отказ от ответственности
Информация и публикации не предназначены для предоставления и не являются финансовыми, инвестиционными, торговыми или другими видами советов или рекомендаций, предоставленных или одобренных TradingView. Подробнее читайте в Условиях использования.
Отказ от ответственности
Информация и публикации не предназначены для предоставления и не являются финансовыми, инвестиционными, торговыми или другими видами советов или рекомендаций, предоставленных или одобренных TradingView. Подробнее читайте в Условиях использования.