
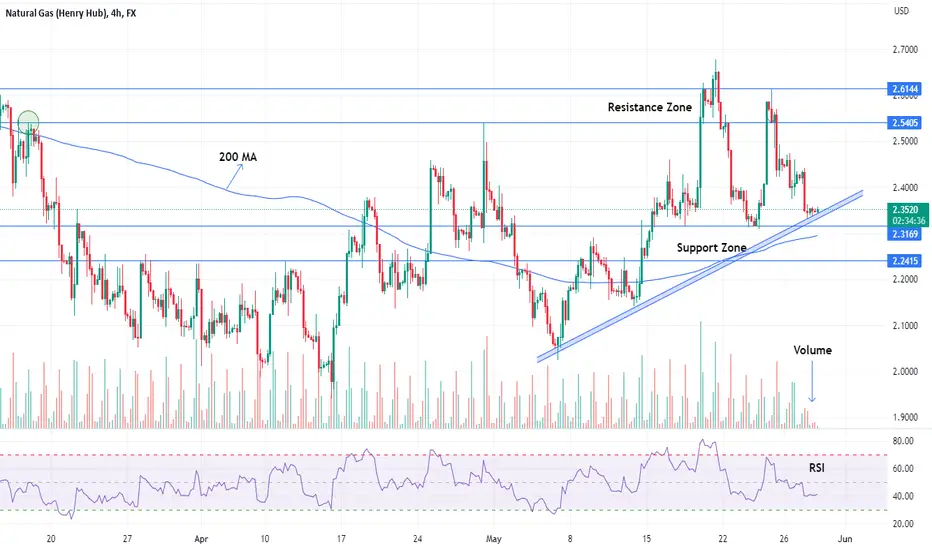
The NATURAL GAS trend is bearish for the last couple of months. The market placed a 1.9625 low on 22-Feb-2023. In a 4Hour time frame market reject the resistance area ( $2.54-2.61 ) as mentioned in the price chart and continued the bearish move. Now price is traded near the Support area ( $2.31-2.24 ). Volume indicates bears lose momentum. Price respect the Trendline in the past two times and now again near to test. Price also traded above the 200 MA ( moving average ) which indicates a bullish trend. So initiate long positions after closing above the Support area and also the trendline. On the other side, Short selling is favorable near the resistance area as mentioned above in the price chart after confirmation by a bearish price action structure.
Support and Resistance levels for day trading ;
Pivot Point Level: PP 2.3776
Support Levels: S1 2.3137, S2 2.2684, S3 2.2045
Resistance Levels: R1 2.4229, R2 2.4868, R3 2.5321
Support and Resistance levels for day trading ;
Pivot Point Level: PP 2.3776
Support Levels: S1 2.3137, S2 2.2684, S3 2.2045
Resistance Levels: R1 2.4229, R2 2.4868, R3 2.5321

Отказ от ответственности
Информация и публикации не предназначены для предоставления и не являются финансовыми, инвестиционными, торговыми или другими видами советов или рекомендаций, предоставленных или одобренных TradingView. Подробнее читайте в Условиях использования.
Отказ от ответственности
Информация и публикации не предназначены для предоставления и не являются финансовыми, инвестиционными, торговыми или другими видами советов или рекомендаций, предоставленных или одобренных TradingView. Подробнее читайте в Условиях использования.