
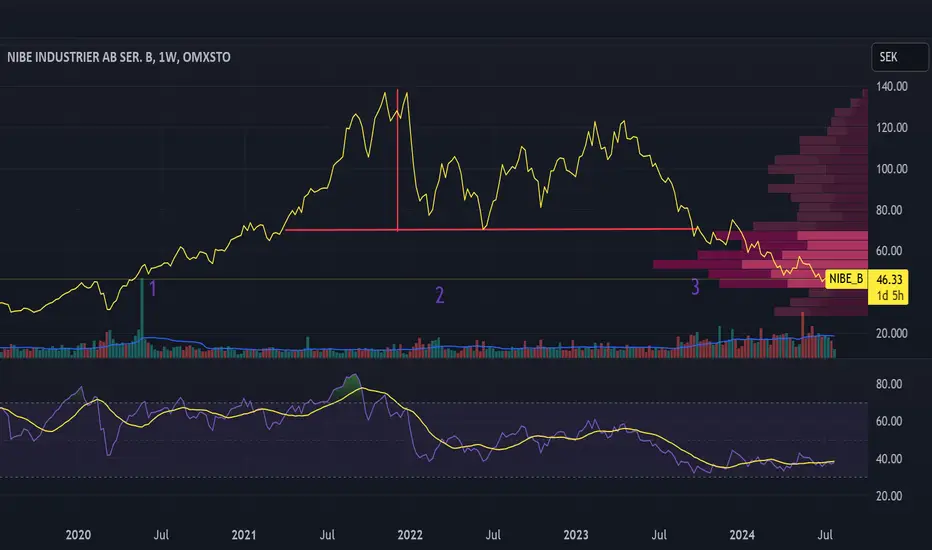
On the 5-year chart, NIBE has a double peak. It is a hypothesis that is to some extent supported by volume. There is a sharp increase in volume when the neckline is broken by the price drop from the second peak (3). Increased volume at the formation of the first and second peaks a little early in the course (1,2).
The object is heading towards 0, but it probably won't be that bad.
It is a long course of time for a double peak, but I've seen it before, for example with GS.
Disclaimer: I bought a number of Swedish stocks at a low price during covid in 2020. Swedish society was not shut down like many other countries. After some time, I have sold most of them again. I have sold out of NIBE twice, but far from the price peak, unfortunately.
Remember you need to do your own research and assessment before buying and selling.
The object is heading towards 0, but it probably won't be that bad.
It is a long course of time for a double peak, but I've seen it before, for example with GS.
Disclaimer: I bought a number of Swedish stocks at a low price during covid in 2020. Swedish society was not shut down like many other countries. After some time, I have sold most of them again. I have sold out of NIBE twice, but far from the price peak, unfortunately.
Remember you need to do your own research and assessment before buying and selling.

Отказ от ответственности
Информация и публикации не предназначены для предоставления и не являются финансовыми, инвестиционными, торговыми или другими видами советов или рекомендаций, предоставленных или одобренных TradingView. Подробнее читайте в Условиях использования.
Отказ от ответственности
Информация и публикации не предназначены для предоставления и не являются финансовыми, инвестиционными, торговыми или другими видами советов или рекомендаций, предоставленных или одобренных TradingView. Подробнее читайте в Условиях использования.