
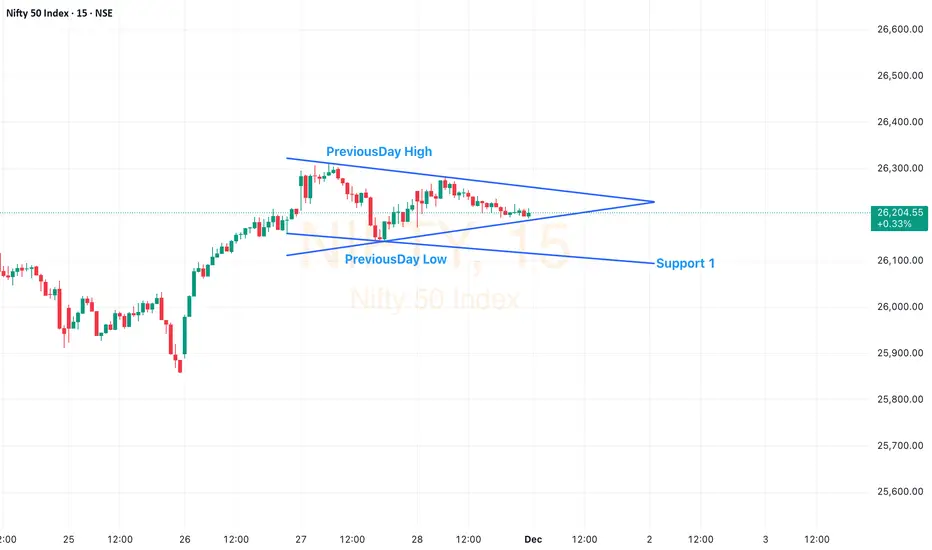
Trading plan:
Gap Up: Wait for pullback → bullish confirmation → long.
Gap Down: Wait for retest → bearish confirmation → short.
Flat Open: Let the triangle breakout guide direction.
Keep SL outside the structure and avoid overtrading inside the triangle.
1️⃣ If Market Opens GAP UP (100–150 points above)
Bias: Bullish but avoid chasing the price. Plan:
Wait for a pullback toward
Previous Day High
Triangle resistance
Any intraday support
Look for bullish price action:
Bullish engulfing
Hammer
Reversal candle with volume
Enter long only after confirmation. SL below the pullback low.
2️⃣ If Market Opens GAP DOWN
Bias: Bearish Plan:
Allow price to retest the lower boundary (previous day low or Support 1).
Enter shorts only on a clean rejection with bearish confirmation.
3️⃣ If Market Opens FLAT (within yesterday’s range)
Bias: Neutral → wait for breakout Plan:
Price is inside the triangle, so expect consolidation.
Trade only after a breakout or breakdown of the pattern.
Breakout above triangle = bullish long.
Breakdown below triangle = bearish short.
Volume confirmation required.
SL outside the triangle opposite side.
Gap Up: Wait for pullback → bullish confirmation → long.
Gap Down: Wait for retest → bearish confirmation → short.
Flat Open: Let the triangle breakout guide direction.
Keep SL outside the structure and avoid overtrading inside the triangle.
1️⃣ If Market Opens GAP UP (100–150 points above)
Bias: Bullish but avoid chasing the price. Plan:
Wait for a pullback toward
Previous Day High
Triangle resistance
Any intraday support
Look for bullish price action:
Bullish engulfing
Hammer
Reversal candle with volume
Enter long only after confirmation. SL below the pullback low.
2️⃣ If Market Opens GAP DOWN
Bias: Bearish Plan:
Allow price to retest the lower boundary (previous day low or Support 1).
Enter shorts only on a clean rejection with bearish confirmation.
3️⃣ If Market Opens FLAT (within yesterday’s range)
Bias: Neutral → wait for breakout Plan:
Price is inside the triangle, so expect consolidation.
Trade only after a breakout or breakdown of the pattern.
Breakout above triangle = bullish long.
Breakdown below triangle = bearish short.
Volume confirmation required.
SL outside the triangle opposite side.
Заметка
Market open gap up bullish but no strength First 5 Min candle was bearish with good volume so sold CALL option.
I do option selling as it help me to manage my risk properly and get profit in case of Theta Decay.

Отказ от ответственности
Информация и публикации не предназначены для предоставления и не являются финансовыми, инвестиционными, торговыми или другими видами советов или рекомендаций, предоставленных или одобренных TradingView. Подробнее читайте в Условиях использования.
Отказ от ответственности
Информация и публикации не предназначены для предоставления и не являются финансовыми, инвестиционными, торговыми или другими видами советов или рекомендаций, предоставленных или одобренных TradingView. Подробнее читайте в Условиях использования.