
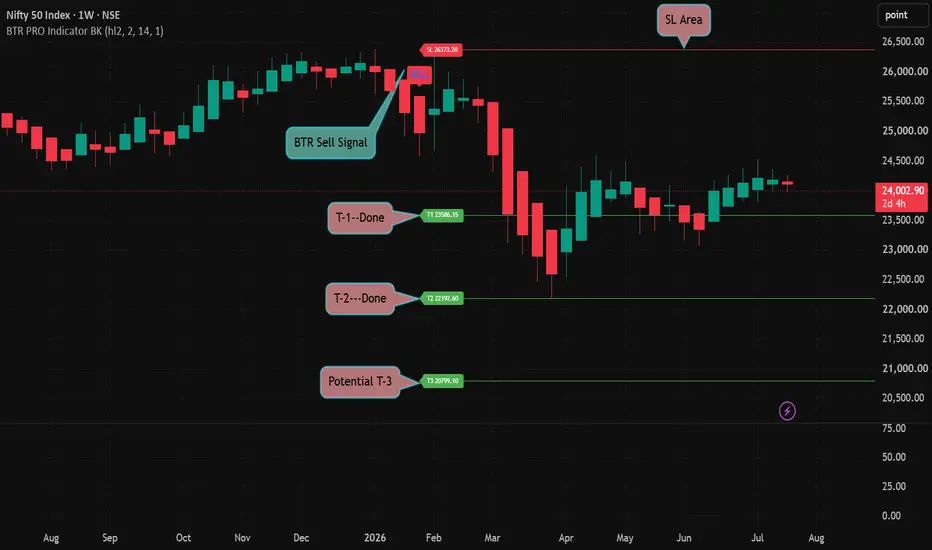
📊 The BTR Sell Signal accurately identified the major market correction, with both Target 1 and Target 2 successfully achieved.
This weekly chart demonstrates the importance of following a disciplined trading system. After the BTR Sell Signal appeared near the market highs, NIFTY experienced a sharp decline, validating the bearish setup.
Trade Review
🔴 BTR Sell Signal Triggered
✅ Target 1 Achieved
✅ Target 2 Achieved
🎯 Potential Target 3: 20,799.10 (Only if fresh bearish momentum develops)
🛡️ Stop Loss: 26,373.20
Current Market Outlook
After the correction, NIFTY has entered a broad consolidation phase. The market is attempting to build a base, but it is still trading well below the previous sell zone. Until a fresh bullish confirmation appears, traders should remain patient and allow price action to dictate the next major trend.
💡 Key Lesson:
The biggest profits often come from holding high-probability positions, not from trading every market swing. A disciplined strategy with predefined entries, stop losses, and targets removes emotion and improves consistency over the long run.
⚠️ This analysis is for educational purposes only and should not be considered investment or trading advice.
This weekly chart demonstrates the importance of following a disciplined trading system. After the BTR Sell Signal appeared near the market highs, NIFTY experienced a sharp decline, validating the bearish setup.
Trade Review
🔴 BTR Sell Signal Triggered
✅ Target 1 Achieved
✅ Target 2 Achieved
🎯 Potential Target 3: 20,799.10 (Only if fresh bearish momentum develops)
🛡️ Stop Loss: 26,373.20
Current Market Outlook
After the correction, NIFTY has entered a broad consolidation phase. The market is attempting to build a base, but it is still trading well below the previous sell zone. Until a fresh bullish confirmation appears, traders should remain patient and allow price action to dictate the next major trend.
💡 Key Lesson:
The biggest profits often come from holding high-probability positions, not from trading every market swing. A disciplined strategy with predefined entries, stop losses, and targets removes emotion and improves consistency over the long run.
⚠️ This analysis is for educational purposes only and should not be considered investment or trading advice.

Похожие публикации
Отказ от ответственности
Информация и публикации не предназначены для предоставления и не являются финансовыми, инвестиционными, торговыми или другими видами советов или рекомендаций, предоставленных или одобренных TradingView. Подробнее читайте в Условиях использования.
Похожие публикации
Отказ от ответственности
Информация и публикации не предназначены для предоставления и не являются финансовыми, инвестиционными, торговыми или другими видами советов или рекомендаций, предоставленных или одобренных TradingView. Подробнее читайте в Условиях использования.