
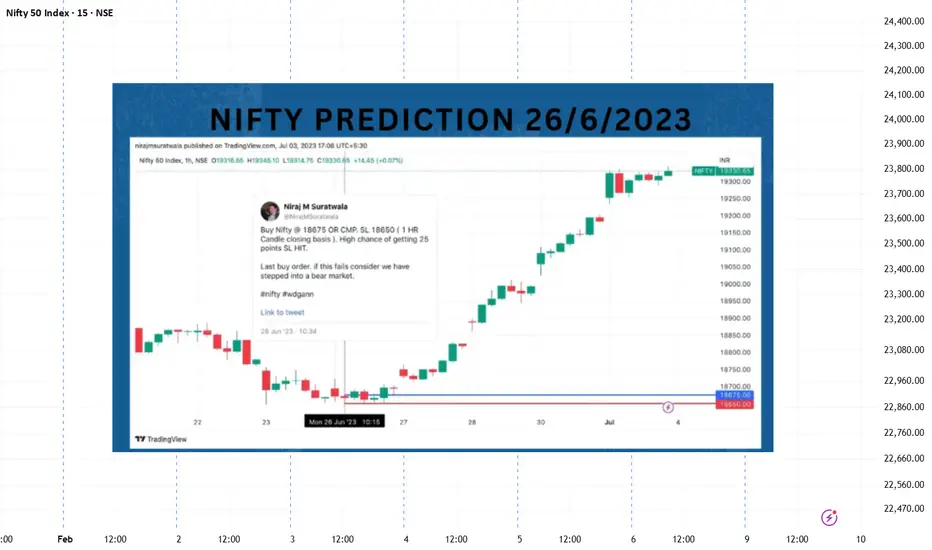
This idea presents a historical, educational chart study demonstrating how price–time structure can be analysed using classical WD Gann methodology.
⚠️ This is not a trade call, prediction, or investment advice.
📌 Market Background
In late June 2023, Nifty was trading near a previous structural price zone while broader sentiment remained cautious.
From a WD Gann perspective:
📊 What the Chart Illustrates
The chart highlights:
🧠 Educational Takeaways
⚠️ Disclaimer
This idea is posted for educational purposes only.
It does not constitute financial advice or future market recommendations.
⚠️ This is not a trade call, prediction, or investment advice.
📌 Market Background
In late June 2023, Nifty was trading near a previous structural price zone while broader sentiment remained cautious.
From a WD Gann perspective:
- Markets respond to pre-defined structural price levels
- Time plays a crucial role in validating support acceptance
- Strong trends often originate from well-aligned price–time zones
📊 What the Chart Illustrates
The chart highlights:
- A key reference support area derived from Gann structure
- Price behaviour around this zone over multiple sessions
- A subsequent price expansion phase after support validation
- This study is shared to explain how structure is observed, not to suggest trades.
🧠 Educational Takeaways
- WD Gann analysis focuses on structure first, direction later
- Support is validated through time + price behavior, not emotion
- Strong directional moves often begin from compressed structures
- Studying historical reactions improves future risk awareness
- This idea is meant purely for learning and methodological understanding.
⚠️ Disclaimer
This idea is posted for educational purposes only.
It does not constitute financial advice or future market recommendations.

Похожие публикации
Отказ от ответственности
Информация и публикации не предназначены для предоставления и не являются финансовыми, инвестиционными, торговыми или другими видами советов или рекомендаций, предоставленных или одобренных TradingView. Подробнее читайте в Условиях использования.
Похожие публикации
Отказ от ответственности
Информация и публикации не предназначены для предоставления и не являются финансовыми, инвестиционными, торговыми или другими видами советов или рекомендаций, предоставленных или одобренных TradingView. Подробнее читайте в Условиях использования.