
Wrap-up:-
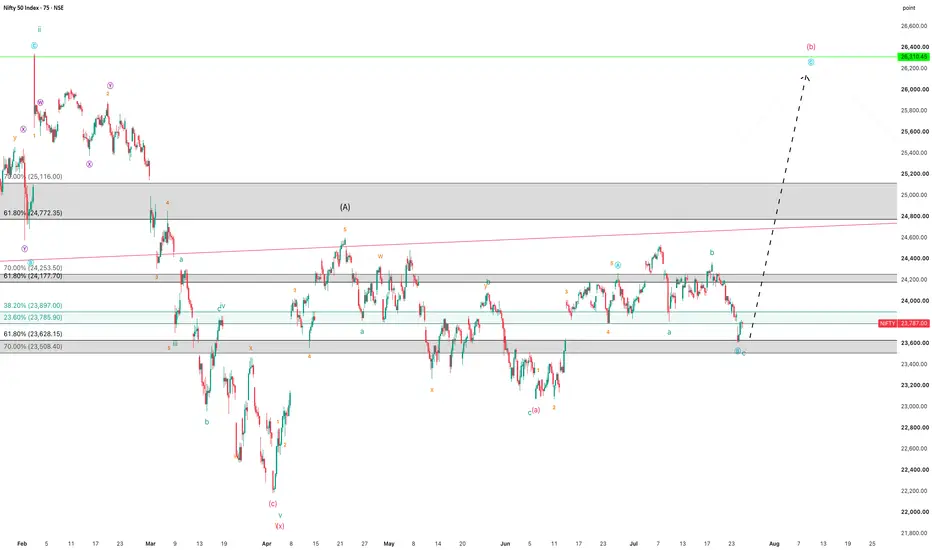
As discussed in my previous Mid-Term NIFTY Analysis (Weekly Chart published on 11 July 2026), the market continues to trade within Wave Y of Wave X of the larger Major Wave 4 corrective structure.
Within Wave Y, Wave A concluded at 24,601, while Wave B is currently unfolding.
Based on the latest price structure, Wave B appears to be developing as an ABC Irregular Correction.
The internal structure is currently interpreted as follows:
Internal Wave A of Wave B completed at 23,070.
Internal Wave B is currently unfolding.
Within this Internal Wave B:
Internal Wave A concluded at 24,261.
Internal Wave B is approaching completion and will be considered confirmed only after NIFTY registers a decisive breakout and sustains above 23,897, thereby validating the Irregular Correction.
Upon confirmation of Internal Wave B, the market is expected to transition into Internal Wave C, with a projected upside objective in the 25,000-26,000 Range.
What I'm Watching | 27 July – 31 July 2026
The immediate focus remains on the completion and confirmation of Internal Wave B.
If the current Elliott Wave count remains valid and NIFTY sustains above 23,897, it would increase the probability of Internal Wave C commencing.
Historically, Wave C often develops as the strongest and most directional leg within an ABC corrective sequence, making this an important phase to monitor.
A sustained move above the identified resistance levels would further strengthen the bullish outlook.
Key Levels to Watch
Immediate Resistance: 23,897
Major Resistance: 24,177-24253 Range
Bullish Projection: 25,000–26,000 (subject to wave confirmation)
Trend Bias: Bullish, unless the current Elliott Wave structure is invalidated.
Professional View:
The broader Elliott Wave structure continues to favour a bullish outlook, provided the current wave count remains valid. While short-term volatility may persist during the completion of Internal Wave B, a decisive breakout above 23,897 would significantly improve the probability of an impulsive advance toward the 25,000–26,000 region.
As always, confirmation through price action should take precedence over anticipation. Traders should monitor key validation levels, remain flexible if the wave structure changes, and apply disciplined risk management.
Disclaimer: This analysis reflects my personal interpretation of the market using Elliott Wave Theory and is shared strictly for educational purposes only. It should not be considered financial or investment advice.
"Don't predict the market. Decode it."
As discussed in my previous Mid-Term NIFTY Analysis (Weekly Chart published on 11 July 2026), the market continues to trade within Wave Y of Wave X of the larger Major Wave 4 corrective structure.
Within Wave Y, Wave A concluded at 24,601, while Wave B is currently unfolding.
Based on the latest price structure, Wave B appears to be developing as an ABC Irregular Correction.
The internal structure is currently interpreted as follows:
Internal Wave A of Wave B completed at 23,070.
Internal Wave B is currently unfolding.
Within this Internal Wave B:
Internal Wave A concluded at 24,261.
Internal Wave B is approaching completion and will be considered confirmed only after NIFTY registers a decisive breakout and sustains above 23,897, thereby validating the Irregular Correction.
Upon confirmation of Internal Wave B, the market is expected to transition into Internal Wave C, with a projected upside objective in the 25,000-26,000 Range.
What I'm Watching | 27 July – 31 July 2026
The immediate focus remains on the completion and confirmation of Internal Wave B.
If the current Elliott Wave count remains valid and NIFTY sustains above 23,897, it would increase the probability of Internal Wave C commencing.
Historically, Wave C often develops as the strongest and most directional leg within an ABC corrective sequence, making this an important phase to monitor.
A sustained move above the identified resistance levels would further strengthen the bullish outlook.
Key Levels to Watch
Immediate Resistance: 23,897
Major Resistance: 24,177-24253 Range
Bullish Projection: 25,000–26,000 (subject to wave confirmation)
Trend Bias: Bullish, unless the current Elliott Wave structure is invalidated.
Professional View:
The broader Elliott Wave structure continues to favour a bullish outlook, provided the current wave count remains valid. While short-term volatility may persist during the completion of Internal Wave B, a decisive breakout above 23,897 would significantly improve the probability of an impulsive advance toward the 25,000–26,000 region.
As always, confirmation through price action should take precedence over anticipation. Traders should monitor key validation levels, remain flexible if the wave structure changes, and apply disciplined risk management.
Disclaimer: This analysis reflects my personal interpretation of the market using Elliott Wave Theory and is shared strictly for educational purposes only. It should not be considered financial or investment advice.
"Don't predict the market. Decode it."

Отказ от ответственности
Информация и публикации не предназначены для предоставления и не являются финансовыми, инвестиционными, торговыми или другими видами советов или рекомендаций, предоставленных или одобренных TradingView. Подробнее читайте в Условиях использования.
Отказ от ответственности
Информация и публикации не предназначены для предоставления и не являются финансовыми, инвестиционными, торговыми или другими видами советов или рекомендаций, предоставленных или одобренных TradingView. Подробнее читайте в Условиях использования.