
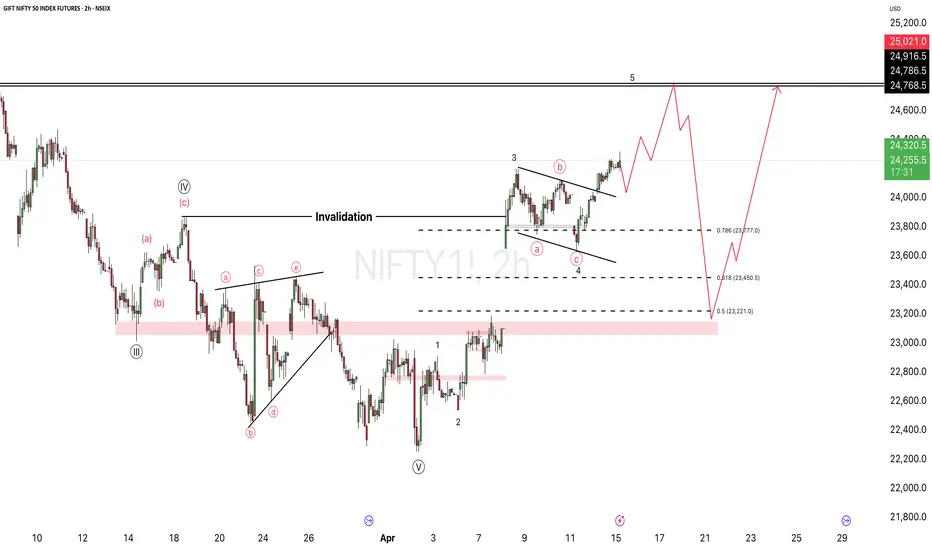
NIFTY is currently trading near 24,245–24,320 zone, and the chart structure continues to show a bullish Wave 5 setup after the recent Wave 4 correction.
The market has successfully respected the 23,777 breakout support, which remains the key level for bullish continuation.
🎯 Bullish Scenario
If price sustains above 24,200–24,250, the next leg of the move can extend toward:
24,768 – 24,786 🎯
This zone is the major resistance / Wave 5 completion area marked on the chart.
The projected move suggests a gradual push higher with minor pullbacks before reaching the target.
⚠️ Pullback / Trap Zone
A healthy correction remains possible before the final upside expansion.
Key retracement levels:
23,777 → immediate support
23,450 → strong demand zone
23,221 → 50% retracement level
If the market loses momentum near highs, a deeper retracement into 23,200 zone can happen before the next rally.
This makes the red path on your chart a possible liquidity sweep scenario before continuation.
🔥 Market View
Overall bias remains bullish unless 23,200 breaks decisively.
The structure still favors:
higher highs
higher lows
strong bullish continuation
Wave 5 target remains active.
The market has successfully respected the 23,777 breakout support, which remains the key level for bullish continuation.
🎯 Bullish Scenario
If price sustains above 24,200–24,250, the next leg of the move can extend toward:
24,768 – 24,786 🎯
This zone is the major resistance / Wave 5 completion area marked on the chart.
The projected move suggests a gradual push higher with minor pullbacks before reaching the target.
⚠️ Pullback / Trap Zone
A healthy correction remains possible before the final upside expansion.
Key retracement levels:
23,777 → immediate support
23,450 → strong demand zone
23,221 → 50% retracement level
If the market loses momentum near highs, a deeper retracement into 23,200 zone can happen before the next rally.
This makes the red path on your chart a possible liquidity sweep scenario before continuation.
🔥 Market View
Overall bias remains bullish unless 23,200 breaks decisively.
The structure still favors:
higher highs
higher lows
strong bullish continuation
Wave 5 target remains active.
Сделка активна
Current StructureStrong impulsive rally completed into Wave (3) near 24,390–24,420
Current pullback is retesting the 0.5–0.618 Fibonacci retracement zone
Important retracement support marked:
0.5 = 24,012
0.618 = 24,102
Price is currently holding around 24,143, which is still inside the healthy pullback zone
This suggests Wave 4 is forming a controlled correction, not a reversal.
Bullish Scenario
As long as price holds above the invalidation zone, this setup strongly favors Wave 5 upside continuation.
Upside Targets
Projected targets from your chart:
24,390–24,417 → immediate resistance retest
24,768–24,786 → major Wave 5 target zone
24,900+ → extended bullish momentum zone
This is where smart money typically pushes after a Wave 4 correction.
Invalidation Level
The most important support is:
24,000–24,012
If price closes below this zone on 2H, the Wave 5 setup weakens.
A deeper correction may then test:
23,850
23,700
Trade Setup
Buy on dips: 24,100–24,150
SL: below 24,000
Targets: 24,420 / 24,780 / 24,900
Risk-reward here looks very strong if support holds 🎯

Отказ от ответственности
Информация и публикации не предназначены для предоставления и не являются финансовыми, инвестиционными, торговыми или другими видами советов или рекомендаций, предоставленных или одобренных TradingView. Подробнее читайте в Условиях использования.
Отказ от ответственности
Информация и публикации не предназначены для предоставления и не являются финансовыми, инвестиционными, торговыми или другими видами советов или рекомендаций, предоставленных или одобренных TradingView. Подробнее читайте в Условиях использования.