
NIO TECHNICAL ANALYSIS
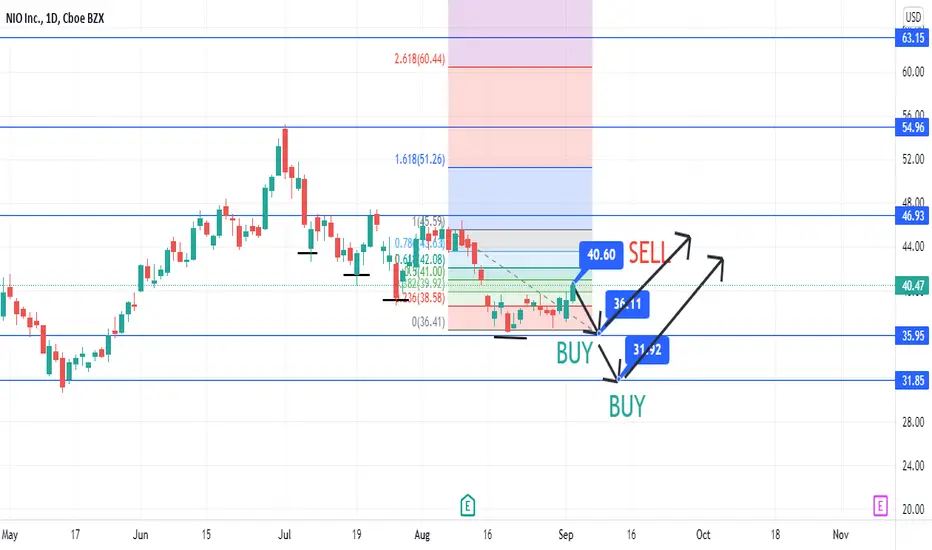
The previous trend and Fibonacci retracement show It will go short around 40$ to 36$. So Sell and wait for the next target as set on the graph at that position 36$ if shows a green candle then take entry after confirmation.
If it breaks this support then the next support is at 32$. IF it goes to 32$ then at this position buy as much.
Also mostly it depends upon the news. So don't forget updates like and follow me for further trading ideas.
Don't hesitate to text me if you've any queries.
Thanks
The previous trend and Fibonacci retracement show It will go short around 40$ to 36$. So Sell and wait for the next target as set on the graph at that position 36$ if shows a green candle then take entry after confirmation.
If it breaks this support then the next support is at 32$. IF it goes to 32$ then at this position buy as much.
Also mostly it depends upon the news. So don't forget updates like and follow me for further trading ideas.
Don't hesitate to text me if you've any queries.
Thanks

Отказ от ответственности
Информация и публикации не предназначены для предоставления и не являются финансовыми, инвестиционными, торговыми или другими видами советов или рекомендаций, предоставленных или одобренных TradingView. Подробнее читайте в Условиях использования.
Отказ от ответственности
Информация и публикации не предназначены для предоставления и не являются финансовыми, инвестиционными, торговыми или другими видами советов или рекомендаций, предоставленных или одобренных TradingView. Подробнее читайте в Условиях использования.