
Hello, traders.
If you "Follow", you can always get new information quickly.
Please click "Boost" as well.
Have a nice day today.
-------------------------------------
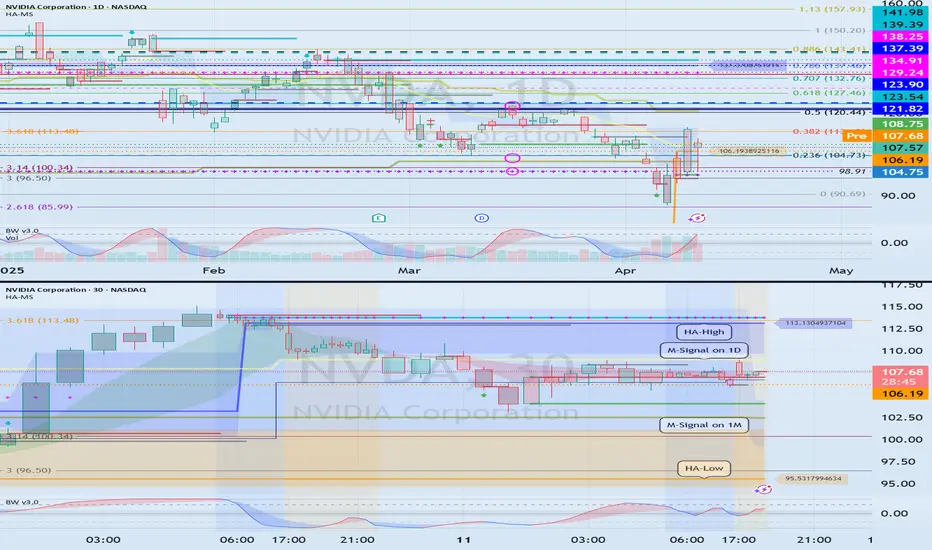
(NVDA Chart)
The HA-Low indicator on the 1D chart was formed at 106.19.
Therefore, the key is whether it can receive support and rise near 106.19.
-
(30m chart)
If it falls below 106.19,
1st: M-Signal indicator on 1M chart
2nd: HA-Low indicator on 30m chart
You need to check if it is supported near the 1st and 2nd above.
In order to continue the uptrend, the price must be maintained above the M-Signal indicator on the 1M chart.
-
(1D chart)
Since the HA-Low indicator on the 1D chart has been newly created, the key is whether it can be supported near this area and rise above the M-Signal indicator on the 1D chart.
If so, it is expected to turn into a short-term uptrend.
If not, there is a possibility of a stepwise downtrend, so the current position is an important section.
-
Thank you for reading to the end.
I hope your transaction will be successful.
--------------------------------------------------

[Practical trading strategy using HA-MS and SBOD]
youtu.be/aceN1AttX1Y
[Renko Bot]
readcrypto.kr/live
youtu.be/aceN1AttX1Y
[Renko Bot]
readcrypto.kr/live
Отказ от ответственности
Информация и публикации не предназначены для предоставления и не являются финансовыми, инвестиционными, торговыми или другими видами советов или рекомендаций, предоставленных или одобренных TradingView. Подробнее читайте в Условиях использования.