
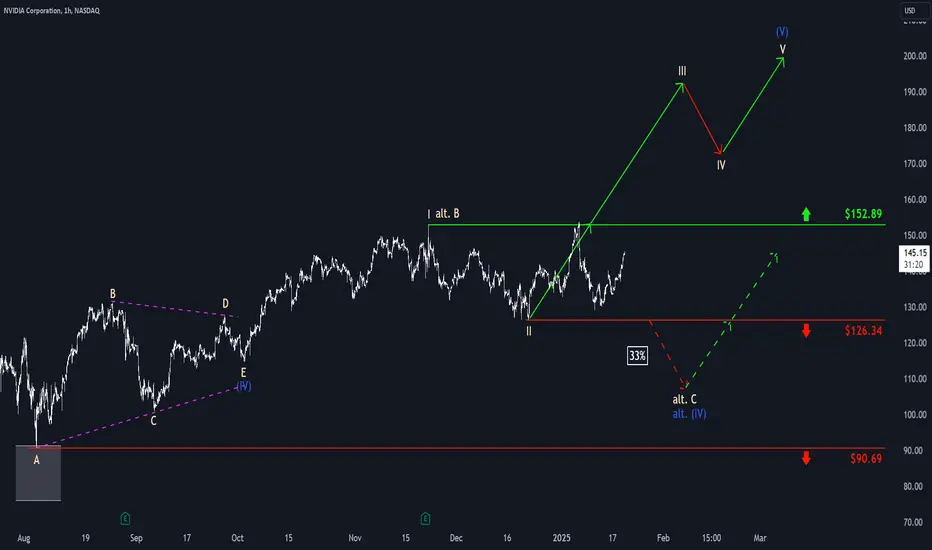
Over the past two weeks, NVDA has exhibited increased fluctuation within the boundaries of the current key levels: the resistance at $152.89 and the support at $126.34. Initially, the price seemed to favor our alternative scenario, but it managed to reverse just in time. Following a dip to $129, the stock rebounded swiftly. Our primary assumption remains that the beige wave III should eventually break above the $152.89 resistance. However, there is still a 33% chance that the expected rises will be delayed by a new low of the blue wave alt.(IV). This alternative scenario will prevail if the stock falls below the $126.34 support level.

📊 Daily market insights combining macro + Elliott Wave analysis
🚀 Spot trends early with momentum, sentiment & price structure
🌐 Join thousands trading smarter at hkcmglobal.com
🚀 Spot trends early with momentum, sentiment & price structure
🌐 Join thousands trading smarter at hkcmglobal.com
Похожие публикации
Отказ от ответственности
Информация и публикации не предназначены для предоставления и не являются финансовыми, инвестиционными, торговыми или другими видами советов или рекомендаций, предоставленных или одобренных TradingView. Подробнее читайте в Условиях использования.
📊 Daily market insights combining macro + Elliott Wave analysis
🚀 Spot trends early with momentum, sentiment & price structure
🌐 Join thousands trading smarter at hkcmglobal.com
🚀 Spot trends early with momentum, sentiment & price structure
🌐 Join thousands trading smarter at hkcmglobal.com
Похожие публикации
Отказ от ответственности
Информация и публикации не предназначены для предоставления и не являются финансовыми, инвестиционными, торговыми или другими видами советов или рекомендаций, предоставленных или одобренных TradingView. Подробнее читайте в Условиях использования.