

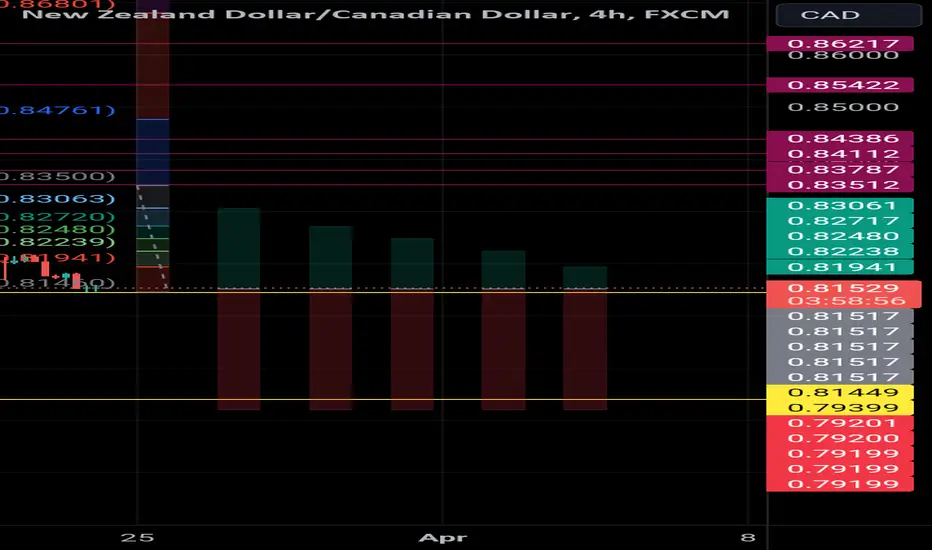
A #long trade opportunity recently presented itself on the #kiwiloonie (#NZDCAD) #trading chart 📈.
This is indicated by the #bullish harami candlestick 🕯️ pattern just above the 0.81449 horizontal support level.
This indicates a rejection of the same level, with potential price move in the upward 👆 ⬆️ direction (#buy).
Sufficient upward momentum should see price rallying towards the 0.84000 psychological level and possibly testing the strength of the 0.83512 horizontal resistance level.
As always, please apply appropriate risk management.
Happy trading!
#crosspair
This is indicated by the #bullish harami candlestick 🕯️ pattern just above the 0.81449 horizontal support level.
This indicates a rejection of the same level, with potential price move in the upward 👆 ⬆️ direction (#buy).
Sufficient upward momentum should see price rallying towards the 0.84000 psychological level and possibly testing the strength of the 0.83512 horizontal resistance level.
As always, please apply appropriate risk management.
Happy trading!
#crosspair

Отказ от ответственности
Информация и публикации не предназначены для предоставления и не являются финансовыми, инвестиционными, торговыми или другими видами советов или рекомендаций, предоставленных или одобренных TradingView. Подробнее читайте в Условиях использования.
Отказ от ответственности
Информация и публикации не предназначены для предоставления и не являются финансовыми, инвестиционными, торговыми или другими видами советов или рекомендаций, предоставленных или одобренных TradingView. Подробнее читайте в Условиях использования.