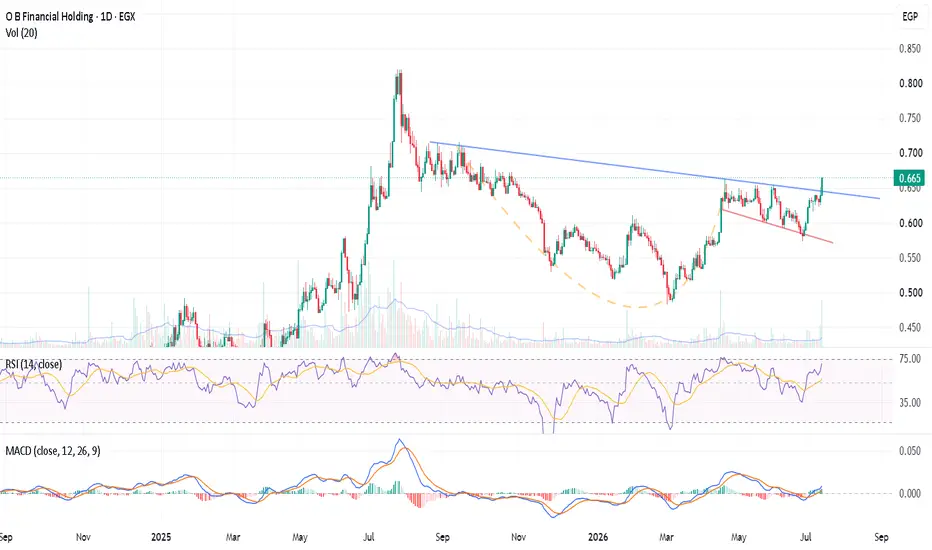
 OFH Daily Chart
1. Trend & Chart Patterns
- Downtrend Resistance Breakout: The stock has executed a breakout above the blue descending trendline connecting the 52-week peak (~0.820) down through the recent lower highs.
- Base Formation / Rounded Bottom: Price action formed a broad rounded base between November 2025 and March 2026 (~0.483 support area), followed by higher lows forming a broad ascending consolidation base.
- Short-Term Channel/Wedge Breakout: A small lower-sloping channel (red support line) held recent retracements, with the current candle breaking upward above both local channel resistance and the long-term trendline.
2. Technical Indicators
- Volume Analysis: High volume spike (260.05M shares vs. 47.76M SMA volume) strongly confirms institutional participation and validates the resistance breakout.
- RSI (14): Currently at 68.78 (Signal line at 52.82), approaching the overbought threshold (>70). Momentum is sharply bullish without showing bearish divergence yet.
- MACD (12, 26, 9): Bullish crossover confirmed with the MACD line rising above the signal line (0.008 vs. 0.003) and the histogram shifting positively green.
Key Price Levels
- Immediate Resistance: 0.680 – 0.700 (Psychological level & structural swing resistance)
- Major Resistance (Targets): 0.750, followed by 0.820 (52-week High)
- Immediate Support / Pivot: 0.640 – 0.650 (Breakout retest zone / Descending trendline boundary)
- Key Support: 0.580 (Red trendline base / Lower swing boundary)
Trading Setup & Scenario
- Bullish Scenario: A daily close above 0.665 with sustained volume confirms the breakout towards 0.700 and 0.750. Conservative traders may wait for a retest of the 0.640–0.650 area as new support before entry.
- Bearish Failure Risk: A slide back inside the descending trendline below 0.630 invalidates the immediate breakout attempt, shifting price back toward range-bound consolidation near 0.580.

Отказ от ответственности
Информация и публикации не предназначены для предоставления и не являются финансовыми, инвестиционными, торговыми или другими видами советов или рекомендаций, предоставленных или одобренных TradingView. Подробнее читайте в Условиях использования.
Отказ от ответственности
Информация и публикации не предназначены для предоставления и не являются финансовыми, инвестиционными, торговыми или другими видами советов или рекомендаций, предоставленных или одобренных TradingView. Подробнее читайте в Условиях использования.