Длинная
OGN Price Prediction
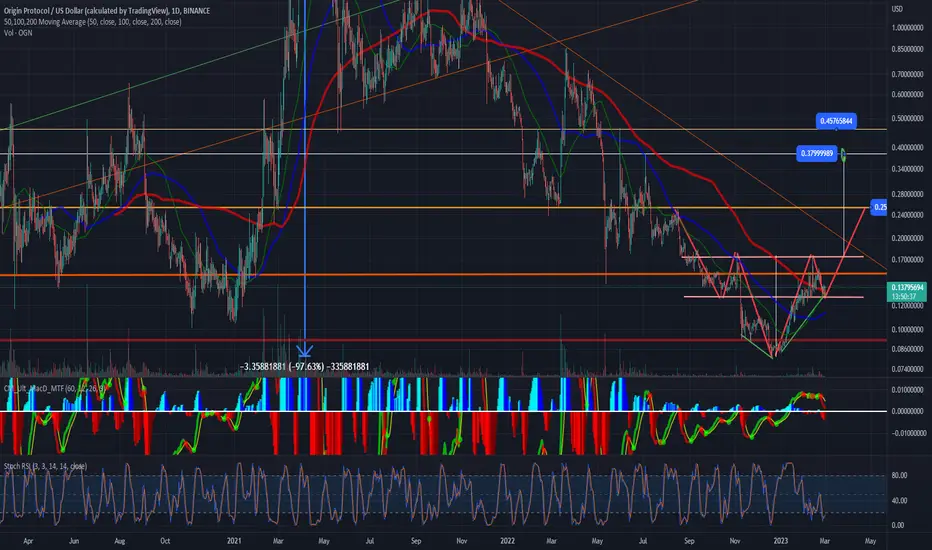
OGN price, forming reversal head and shoulder pattern, which the formation it might ends in the middle of march.
Then we can see, bounce from the lows of 0.13 cents until 0.25 cents for the begining of an upside leg.
If we stay above the 0.25 cents as support, we then can see more upside legs froming until 0.37 ~ 0.45 as you can see in the chart.
RSI remaining fro the time being, near oversold area.
This can be good time to buy!
Then we can see, bounce from the lows of 0.13 cents until 0.25 cents for the begining of an upside leg.
If we stay above the 0.25 cents as support, we then can see more upside legs froming until 0.37 ~ 0.45 as you can see in the chart.
RSI remaining fro the time being, near oversold area.
This can be good time to buy!

Отказ от ответственности
Информация и публикации не предназначены для предоставления и не являются финансовыми, инвестиционными, торговыми или другими видами советов или рекомендаций, предоставленных или одобренных TradingView. Подробнее читайте в Условиях использования.
Отказ от ответственности
Информация и публикации не предназначены для предоставления и не являются финансовыми, инвестиционными, торговыми или другими видами советов или рекомендаций, предоставленных или одобренных TradingView. Подробнее читайте в Условиях использования.