
**PI/USDT – 30-Minute Chart Analysis**
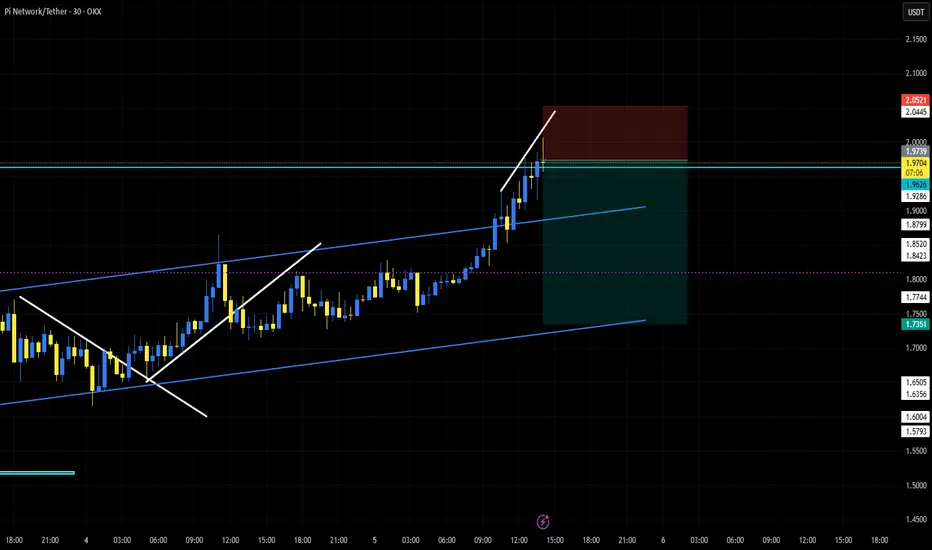
The price is moving within an ascending channel and has recently reached the **1.9730 - 2.0445** resistance zone. A rising wedge pattern has formed at the top of this trend, which could indicate weakening bullish momentum.
If the price reacts negatively to this level, a correction towards the **1.8500 - 1.8200** range is possible. Conversely, if the resistance is broken, the price could move towards **2.1000**.
The price is moving within an ascending channel and has recently reached the **1.9730 - 2.0445** resistance zone. A rising wedge pattern has formed at the top of this trend, which could indicate weakening bullish momentum.
If the price reacts negatively to this level, a correction towards the **1.8500 - 1.8200** range is possible. Conversely, if the resistance is broken, the price could move towards **2.1000**.
Сделка активна
Close at TP1
Отказ от ответственности
Информация и публикации не предназначены для предоставления и не являются финансовыми, инвестиционными, торговыми или другими видами советов или рекомендаций, предоставленных или одобренных TradingView. Подробнее читайте в Условиях использования.
Отказ от ответственности
Информация и публикации не предназначены для предоставления и не являются финансовыми, инвестиционными, торговыми или другими видами советов или рекомендаций, предоставленных или одобренных TradingView. Подробнее читайте в Условиях использования.