
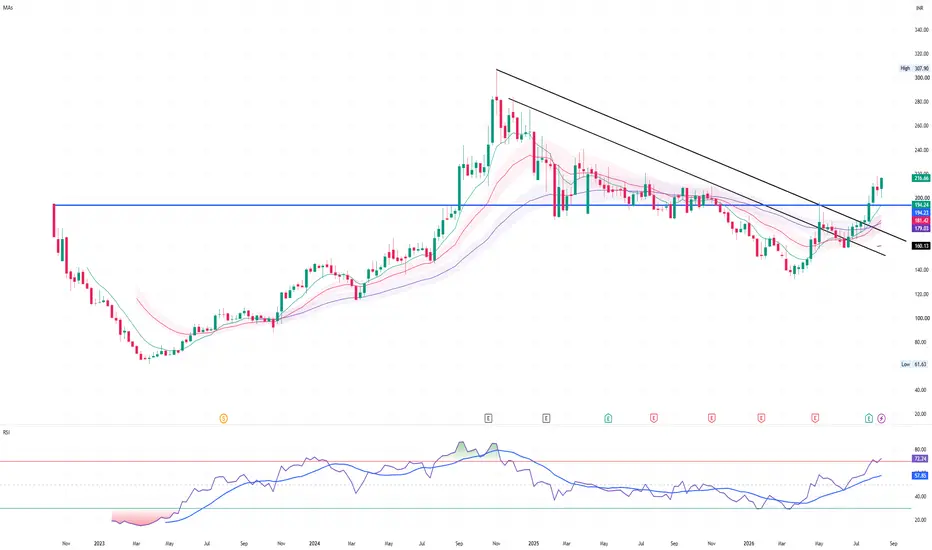
Current price: ₹216.66 | Weekly chart
- Trend: Strong bullish reversal. Price has broken above the long-term falling trendline and the major ₹194 resistance.
- Moving averages: Price is above all shown MAs — ₹194, ₹181, ₹179 — and they are beginning to turn upward. This is a strong trend-improvement signal.
- Breakout: The move above ₹194 is the key event. The breakout is accompanied by a strong candle, making it more credible.
- Momentum: RSI 72.24 — very strong, but now technically overbought. This means momentum is excellent, but chasing at ₹216–220 carries higher short-term pullback risk.
- Immediate resistance: ₹220–225
- Next targets: ₹240–250, then ₹270–280
- Major historical resistance: ₹280–290; above that, the chart opens toward ₹300+.
- Breakout support: ₹194–200. A successful retest of this zone would be particularly attractive.
- Deeper support: ₹179–181.
Best strategy: Don't chase the +20% type move after the breakout. I'd prefer either:
1. ₹200–205 retest + bullish reversal, or
2. A sustained weekly close above ₹220, followed by continuation.
Risk signal: A weekly close back below ₹194 would make the breakout questionable.
My read
This is stronger than a simple bounce. The combination of trendline breakout + ₹194 resistance breakout + price above all major MAs + rising RSI gives PPL Pharma a genuine medium-term bullish setup.
Probability framework from the chart:
🟢 Bullish continuation: ~70%
🟡 Consolidation/pullback: ~25%
🔴 Failed breakout: ~5%
- Trend: Strong bullish reversal. Price has broken above the long-term falling trendline and the major ₹194 resistance.
- Moving averages: Price is above all shown MAs — ₹194, ₹181, ₹179 — and they are beginning to turn upward. This is a strong trend-improvement signal.
- Breakout: The move above ₹194 is the key event. The breakout is accompanied by a strong candle, making it more credible.
- Momentum: RSI 72.24 — very strong, but now technically overbought. This means momentum is excellent, but chasing at ₹216–220 carries higher short-term pullback risk.
- Immediate resistance: ₹220–225
- Next targets: ₹240–250, then ₹270–280
- Major historical resistance: ₹280–290; above that, the chart opens toward ₹300+.
- Breakout support: ₹194–200. A successful retest of this zone would be particularly attractive.
- Deeper support: ₹179–181.
Best strategy: Don't chase the +20% type move after the breakout. I'd prefer either:
1. ₹200–205 retest + bullish reversal, or
2. A sustained weekly close above ₹220, followed by continuation.
Risk signal: A weekly close back below ₹194 would make the breakout questionable.
My read
This is stronger than a simple bounce. The combination of trendline breakout + ₹194 resistance breakout + price above all major MAs + rising RSI gives PPL Pharma a genuine medium-term bullish setup.
Probability framework from the chart:
🟢 Bullish continuation: ~70%
🟡 Consolidation/pullback: ~25%
🔴 Failed breakout: ~5%

Отказ от ответственности
Информация и публикации не предназначены для предоставления и не являются финансовыми, инвестиционными, торговыми или другими видами советов или рекомендаций, предоставленных или одобренных TradingView. Подробнее читайте в Условиях использования.
Отказ от ответственности
Информация и публикации не предназначены для предоставления и не являются финансовыми, инвестиционными, торговыми или другими видами советов или рекомендаций, предоставленных или одобренных TradingView. Подробнее читайте в Условиях использования.