
📈 Subject: RBL Bank – Weekly Chart Breakout Setup 🚀
🟢 Strong Bullish Structure Emerging!
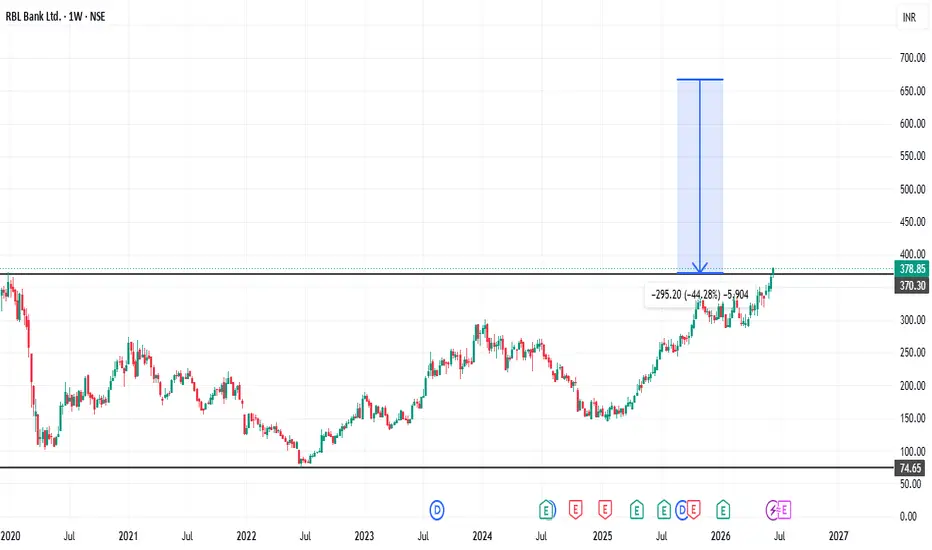
RBL Bank is trading near ₹378.85, gaining +3.55% on the weekly timeframe. 💪
Price is approaching a major resistance zone around ₹380–₹400, signaling a potential breakout. 🎯
A successful breakout above this zone could open the path toward the ₹650–₹675 range in the longer term. 🚀
The stock has formed a series of higher highs and higher lows, confirming a strong uptrend. 📈
Banking sector strength and improving momentum add support to the bullish outlook. 🏦
⚠️ Risk Management: A sustained move above resistance is key. Failure to hold above ₹350–₹360 may lead to short-term consolidation. 🛡️
✨ Overall View: Long-term trend remains positive, with a breakout above ₹400 potentially triggering the next leg of the rally. 🚀📊
🟢 Strong Bullish Structure Emerging!
RBL Bank is trading near ₹378.85, gaining +3.55% on the weekly timeframe. 💪
Price is approaching a major resistance zone around ₹380–₹400, signaling a potential breakout. 🎯
A successful breakout above this zone could open the path toward the ₹650–₹675 range in the longer term. 🚀
The stock has formed a series of higher highs and higher lows, confirming a strong uptrend. 📈
Banking sector strength and improving momentum add support to the bullish outlook. 🏦
⚠️ Risk Management: A sustained move above resistance is key. Failure to hold above ₹350–₹360 may lead to short-term consolidation. 🛡️
✨ Overall View: Long-term trend remains positive, with a breakout above ₹400 potentially triggering the next leg of the rally. 🚀📊

Отказ от ответственности
Информация и публикации не предназначены для предоставления и не являются финансовыми, инвестиционными, торговыми или другими видами советов или рекомендаций, предоставленных или одобренных TradingView. Подробнее читайте в Условиях использования.
Отказ от ответственности
Информация и публикации не предназначены для предоставления и не являются финансовыми, инвестиционными, торговыми или другими видами советов или рекомендаций, предоставленных или одобренных TradingView. Подробнее читайте в Условиях использования.