
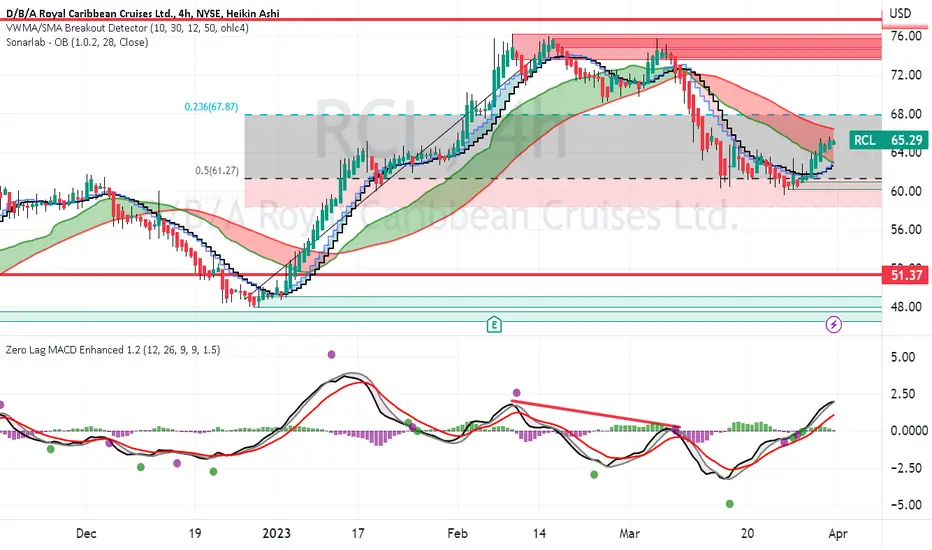
RCL had a triple top this past winder then downtrend to the Fib 0.5 level.
On the chart, the tripe top is also resistance with sell orders blocks by the indicator.
The fib 0.5 level $ 61.27 is the support. A stop loss could be placed immediately
below that. The zero-lag MACD shows nearish divergence while the price rose into
the triple. That divergence has not yet recurred. I see this as a swing long while
RCL seeks to recover its customer base and rebuild its revenue stream.
On the chart, the tripe top is also resistance with sell orders blocks by the indicator.
The fib 0.5 level $ 61.27 is the support. A stop loss could be placed immediately
below that. The zero-lag MACD shows nearish divergence while the price rose into
the triple. That divergence has not yet recurred. I see this as a swing long while
RCL seeks to recover its customer base and rebuild its revenue stream.

Отказ от ответственности
Информация и публикации не предназначены для предоставления и не являются финансовыми, инвестиционными, торговыми или другими видами советов или рекомендаций, предоставленных или одобренных TradingView. Подробнее читайте в Условиях использования.
Отказ от ответственности
Информация и публикации не предназначены для предоставления и не являются финансовыми, инвестиционными, торговыми или другими видами советов или рекомендаций, предоставленных или одобренных TradingView. Подробнее читайте в Условиях использования.