
1. Price Action and Trend Structure
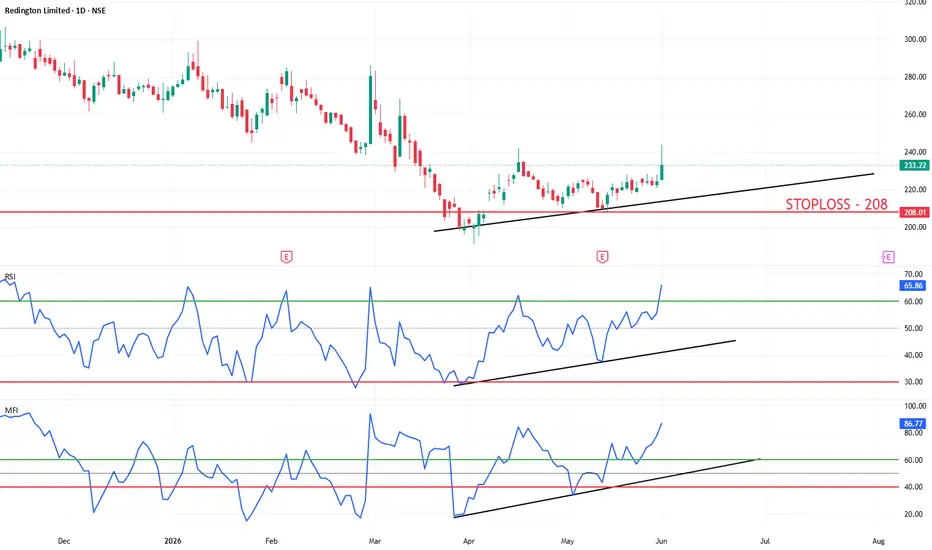
The Setup: The daily chart illustrates a clear structural shift. After a markdown phase earlier in the year, the stock found a bottom in late March/early April. Since then, it has been printing higher lows. The black ascending trendline correctly captures this new upward trajectory, acting as dynamic support.
Current Move: The most recent daily candle (closing at 233.22, up 3.96%) is a strong, full-bodied bullish candle. It demonstrates aggressive buying pressure, signaling a potential breakout from the recent short-term consolidation.
2. Momentum and Volume Indicators
RSI (Relative Strength Index): The RSI is currently at 65.86. The ascending trendline drawn on the RSI confirms that momentum is increasing alongside the price (no bearish divergence). At ~66, it is in strong bullish territory, with some room left before hitting the traditional overbought threshold of 70.
MFI (Money Flow Index): The MFI is currently at 86.77. The rising trendline here validates that the price increase is being supported by significant capital inflows (volume). Note: An MFI above 80 is considered heavily overbought. While this highlights massive buying interest, it also suggests the stock might need to digest these gains with a brief consolidation or minor pullback soon.
The Setup: The daily chart illustrates a clear structural shift. After a markdown phase earlier in the year, the stock found a bottom in late March/early April. Since then, it has been printing higher lows. The black ascending trendline correctly captures this new upward trajectory, acting as dynamic support.
Current Move: The most recent daily candle (closing at 233.22, up 3.96%) is a strong, full-bodied bullish candle. It demonstrates aggressive buying pressure, signaling a potential breakout from the recent short-term consolidation.
2. Momentum and Volume Indicators
RSI (Relative Strength Index): The RSI is currently at 65.86. The ascending trendline drawn on the RSI confirms that momentum is increasing alongside the price (no bearish divergence). At ~66, it is in strong bullish territory, with some room left before hitting the traditional overbought threshold of 70.
MFI (Money Flow Index): The MFI is currently at 86.77. The rising trendline here validates that the price increase is being supported by significant capital inflows (volume). Note: An MFI above 80 is considered heavily overbought. While this highlights massive buying interest, it also suggests the stock might need to digest these gains with a brief consolidation or minor pullback soon.

Отказ от ответственности
Информация и публикации не предназначены для предоставления и не являются финансовыми, инвестиционными, торговыми или другими видами советов или рекомендаций, предоставленных или одобренных TradingView. Подробнее читайте в Условиях использования.
Отказ от ответственности
Информация и публикации не предназначены для предоставления и не являются финансовыми, инвестиционными, торговыми или другими видами советов или рекомендаций, предоставленных или одобренных TradingView. Подробнее читайте в Условиях использования.