
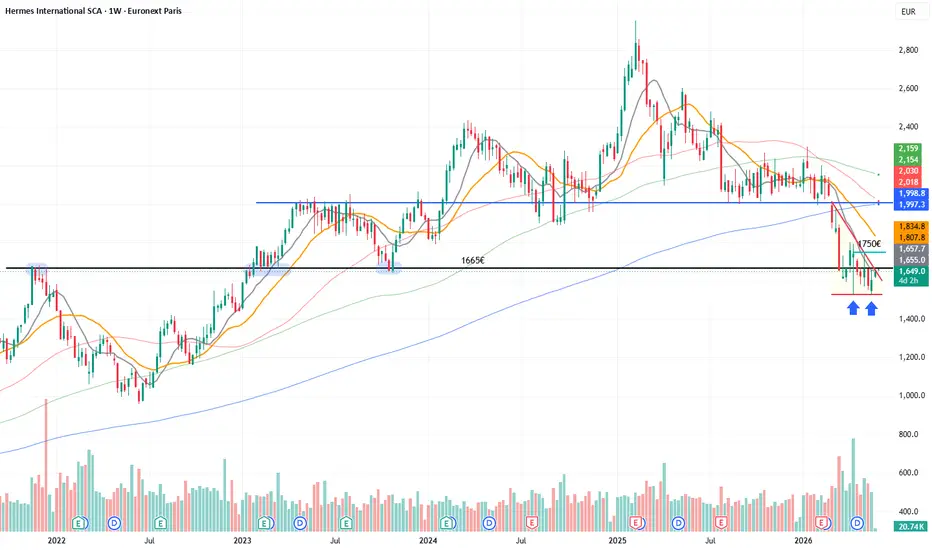
An interesting chart structure with two possible outcomes yet to be determined.
The price is moving within the red triangle and is currently near the upper boundary.
A bullish view suggests a potential breakout followed by the completion of a double bottom pattern, with the neckline at €1,750.
Conversely, in a bearish scenario, the price has just been rejected by the weekly SMA10 near the upper edge, with a probable return toward the bottom of the triangle, where a bearish breakout could follow.

I’ve noticed that many stocks in the luxury sector are currently sitting just below major resistance levels awaiting a breakout... what is about to happen?
This is just food for thought, as I believe the best move is to place some alert, wait and see which side of the triangle breaks first.
Keep a close eye on the volumes!
The price is moving within the red triangle and is currently near the upper boundary.
A bullish view suggests a potential breakout followed by the completion of a double bottom pattern, with the neckline at €1,750.
Conversely, in a bearish scenario, the price has just been rejected by the weekly SMA10 near the upper edge, with a probable return toward the bottom of the triangle, where a bearish breakout could follow.
I’ve noticed that many stocks in the luxury sector are currently sitting just below major resistance levels awaiting a breakout... what is about to happen?
This is just food for thought, as I believe the best move is to place some alert, wait and see which side of the triangle breaks first.
Keep a close eye on the volumes!

Отказ от ответственности
Информация и публикации не предназначены для предоставления и не являются финансовыми, инвестиционными, торговыми или другими видами советов или рекомендаций, предоставленных или одобренных TradingView. Подробнее читайте в Условиях использования.
Отказ от ответственности
Информация и публикации не предназначены для предоставления и не являются финансовыми, инвестиционными, торговыми или другими видами советов или рекомендаций, предоставленных или одобренных TradingView. Подробнее читайте в Условиях использования.