
📌 Current Price
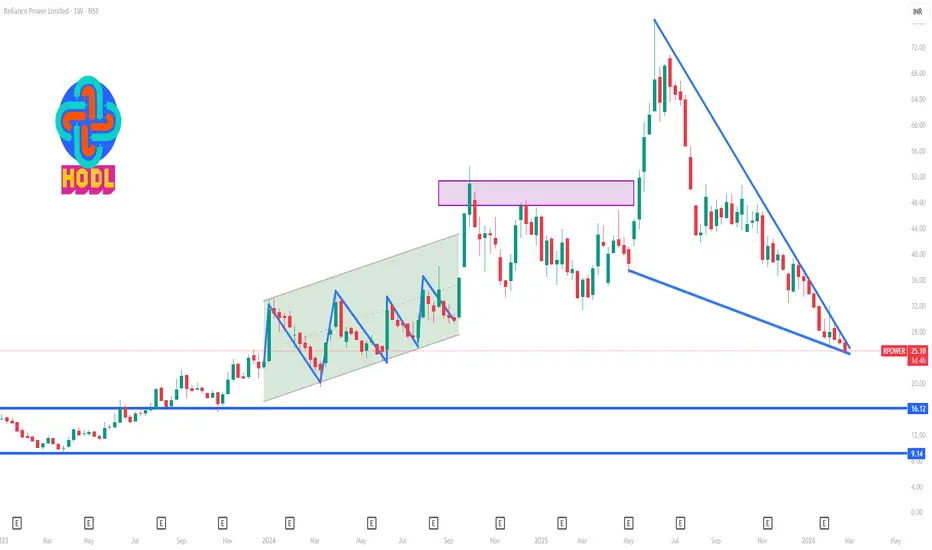
• RPOWER is trading around ₹25 – ₹25.4 per share, near its 52-week low.
📈 1-Week Timeframe: Key Levels to Watch
🔹 Immediate Support Levels
₹24.9–₹25.0 — very near current low range and 52-week support zone.
₹23.5–₹24.0 — secondary support if breakdown below current low happens (psychological + round number). Estimated from recent price levels.
🔸 Immediate Resistance Levels
₹26.5–₹27.0 — nearest short-term resistance zone (recent recent range high candles). Derived from price swings on chart.
₹28.0–₹29.0 — next layer where sellers are often visible for this stock in recent consolidation behaviour. Standard resistance cluster based on price swings.
⭐ 1-Week Trading Range (estimated)
Downside bearish range: ~ ₹24.5–₹25
Upside bullish range (if bounce): ~ ₹26.5–₹28
👉 In the very short term, the price tends to trade in a narrow range with the above support/resistance until a clear breakout or breakdown occurs.
📊 Technical Indicators (Context)
• Current price is extremely close to its lowest weekly levels of the past year → indicates oversold territory in weekly timeframe.
• If price breaks and closes below ₹24.9, weekly momentum could extend further downward.
• A sustained move above ₹27 would indicate a short-term bounce.
• RPOWER is trading around ₹25 – ₹25.4 per share, near its 52-week low.
📈 1-Week Timeframe: Key Levels to Watch
🔹 Immediate Support Levels
₹24.9–₹25.0 — very near current low range and 52-week support zone.
₹23.5–₹24.0 — secondary support if breakdown below current low happens (psychological + round number). Estimated from recent price levels.
🔸 Immediate Resistance Levels
₹26.5–₹27.0 — nearest short-term resistance zone (recent recent range high candles). Derived from price swings on chart.
₹28.0–₹29.0 — next layer where sellers are often visible for this stock in recent consolidation behaviour. Standard resistance cluster based on price swings.
⭐ 1-Week Trading Range (estimated)
Downside bearish range: ~ ₹24.5–₹25
Upside bullish range (if bounce): ~ ₹26.5–₹28
👉 In the very short term, the price tends to trade in a narrow range with the above support/resistance until a clear breakout or breakdown occurs.
📊 Technical Indicators (Context)
• Current price is extremely close to its lowest weekly levels of the past year → indicates oversold territory in weekly timeframe.
• If price breaks and closes below ₹24.9, weekly momentum could extend further downward.
• A sustained move above ₹27 would indicate a short-term bounce.

Contact Knowledgehub for a detailed consultation: Dm on WhatsApp: [wa.link/a2o0kz]-
Phone No: [+91 93102 26243]-
Email: [tradingviewknowledgehub@gmail.com]---
-- Let’s achieve success together!
Phone No: [+91 93102 26243]-
Email: [tradingviewknowledgehub@gmail.com]---
-- Let’s achieve success together!
Похожие публикации
Отказ от ответственности
Информация и публикации не предназначены для предоставления и не являются финансовыми, инвестиционными, торговыми или другими видами советов или рекомендаций, предоставленных или одобренных TradingView. Подробнее читайте в Условиях использования.
Contact Knowledgehub for a detailed consultation: Dm on WhatsApp: [wa.link/a2o0kz]-
Phone No: [+91 93102 26243]-
Email: [tradingviewknowledgehub@gmail.com]---
-- Let’s achieve success together!
Phone No: [+91 93102 26243]-
Email: [tradingviewknowledgehub@gmail.com]---
-- Let’s achieve success together!
Похожие публикации
Отказ от ответственности
Информация и публикации не предназначены для предоставления и не являются финансовыми, инвестиционными, торговыми или другими видами советов или рекомендаций, предоставленных или одобренных TradingView. Подробнее читайте в Условиях использования.