
Hi;
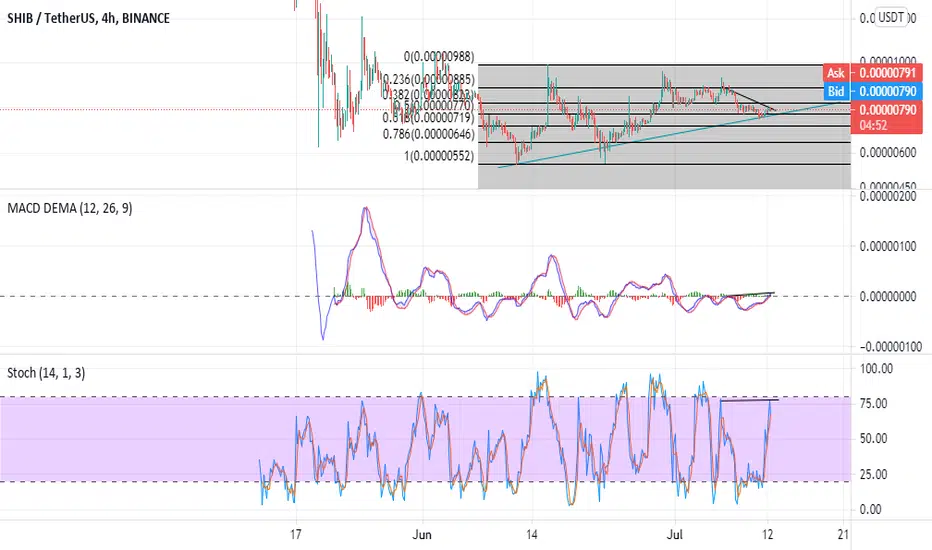
According to the chart, there is divergence between the price and MACD & stochastic indicators. We can also draw a trend line from 12 jun. fib retracement shows a support at fib 0.5.
In fundamental point of view, based on blockchain data there is an increase in number of coin holders from yesterday and from the beginning till now. Also there is an increase in number of top holders. It shows that whales did not sell their coins and prefer to hold.
Thanks in advance for your valuable comments and likes.
According to the chart, there is divergence between the price and MACD & stochastic indicators. We can also draw a trend line from 12 jun. fib retracement shows a support at fib 0.5.
In fundamental point of view, based on blockchain data there is an increase in number of coin holders from yesterday and from the beginning till now. Also there is an increase in number of top holders. It shows that whales did not sell their coins and prefer to hold.
Thanks in advance for your valuable comments and likes.

Отказ от ответственности
Информация и публикации не предназначены для предоставления и не являются финансовыми, инвестиционными, торговыми или другими видами советов или рекомендаций, предоставленных или одобренных TradingView. Подробнее читайте в Условиях использования.
Отказ от ответственности
Информация и публикации не предназначены для предоставления и не являются финансовыми, инвестиционными, торговыми или другими видами советов или рекомендаций, предоставленных или одобренных TradingView. Подробнее читайте в Условиях использования.