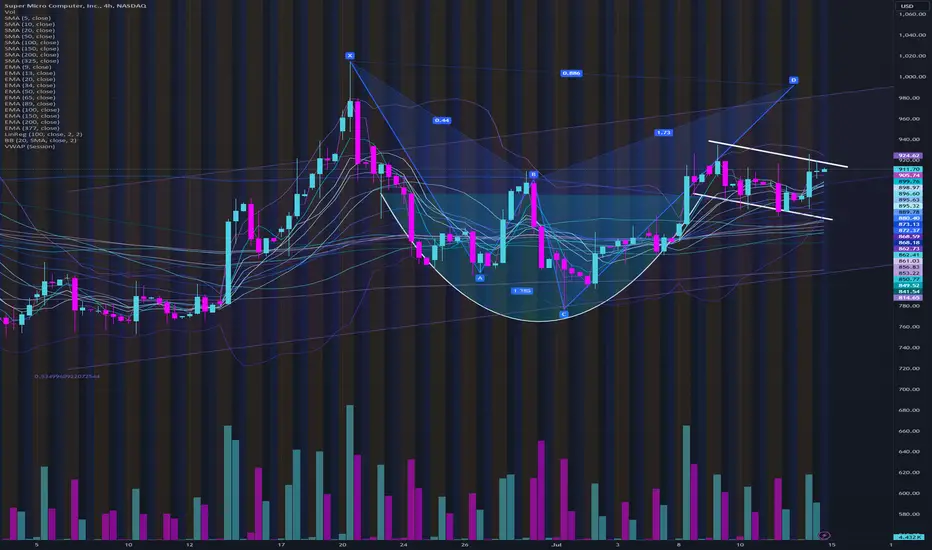
 SMCI shows a bullish cup and handle on the four-hour chart, as well as a bullish Gartley harmonic. Point C of the harmonic lined up with the lower four-hour 100 linear regression channel and provided the best entry. The middle of the four-hour 100 linear regression channel coincided with the handle of the cup, as well as the weekly 20 SMA, which provided another excellent entry with more confirmation.
 Заметка
SMCI reached the target at the upper four-hour 100 linear regression channel, and then proceeded to reverse from point D on the bearish Gartley harmonic. As noted in my previous comment, the move was short term bullish on the leg from C to D, before completing the pattern and rejecting supply into point D, and trading to the bottom of the channel.Сделка закрыта: достигнута тейк-профит цена
The bearish Gartley harmonic played out at point D, where the long was closed and the short was opened. The short is now approaching key demand levels with runners up nearly $250/share.
Похожие публикации
Отказ от ответственности
Информация и публикации не предназначены для предоставления и не являются финансовыми, инвестиционными, торговыми или другими видами советов или рекомендаций, предоставленных или одобренных TradingView. Подробнее читайте в Условиях использования.
Похожие публикации
Отказ от ответственности
Информация и публикации не предназначены для предоставления и не являются финансовыми, инвестиционными, торговыми или другими видами советов или рекомендаций, предоставленных или одобренных TradingView. Подробнее читайте в Условиях использования.