
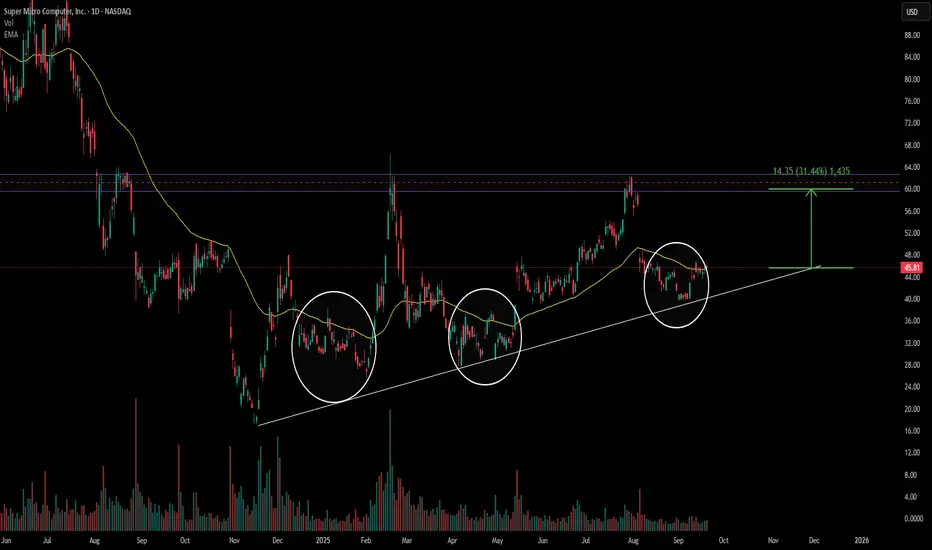
Every time price makes a fake breakdown below the 50 EMA, it quickly recovers and pushes higher.
Historically, these moves have led price to test the purple resistance zone highlighted on the chart.
Given the repeated pattern, I think the same dynamic could play out again, with price eventually making its way back to that resistance area.
🎯 Conclusion: Based on prior reactions to the 50 EMA, I expect SMCI to work its way toward the purple resistance zone. This is my professional view from the chart structure, though markets remain uncertain and no outcome is guaranteed.
👉 Stay tuned for more structured market insights — follow along for consistent expert-level analysis.

Отказ от ответственности
Информация и публикации не предназначены для предоставления и не являются финансовыми, инвестиционными, торговыми или другими видами советов или рекомендаций, предоставленных или одобренных TradingView. Подробнее читайте в Условиях использования.
Отказ от ответственности
Информация и публикации не предназначены для предоставления и не являются финансовыми, инвестиционными, торговыми или другими видами советов или рекомендаций, предоставленных или одобренных TradingView. Подробнее читайте в Условиях использования.