
This one is tricky.
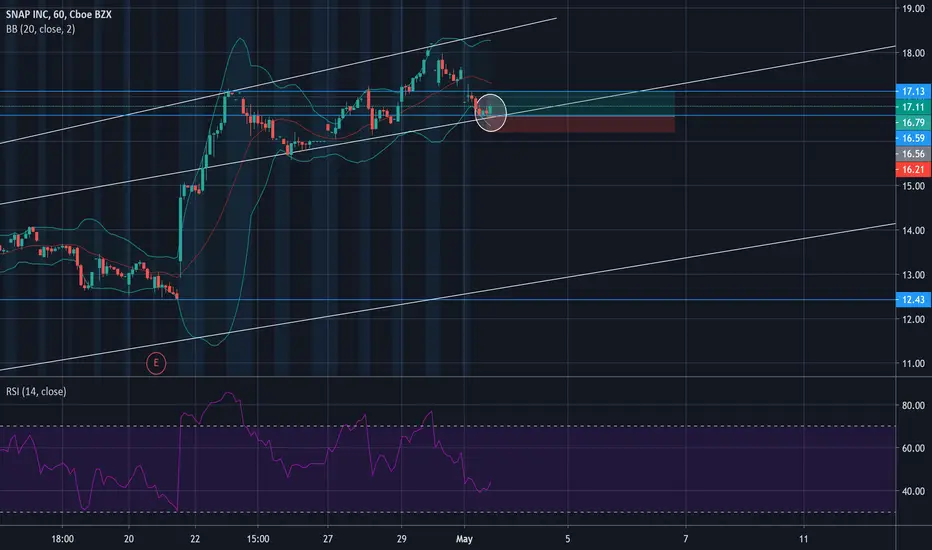
1) There is a big engulfing candlestick, which suggests that there will be an up movement, you could take this long position and make your profit just on the above resistance ($17.13).
2) wait to see what happens when it reaches that resistance ($17.13) :
if it fails to break out, there is will be ahead and shoulder pattern suggesting a change in momentum, you can short it then.
3) Bollinger band are suggesting a move upward
1) There is a big engulfing candlestick, which suggests that there will be an up movement, you could take this long position and make your profit just on the above resistance ($17.13).
2) wait to see what happens when it reaches that resistance ($17.13) :
if it fails to break out, there is will be ahead and shoulder pattern suggesting a change in momentum, you can short it then.
3) Bollinger band are suggesting a move upward
Сделка закрыта: достигнута тейк-профит цена
I'm closing this since it reached $17.16 today what I had expected ($17.13)
Отказ от ответственности
Информация и публикации не предназначены для предоставления и не являются финансовыми, инвестиционными, торговыми или другими видами советов или рекомендаций, предоставленных или одобренных TradingView. Подробнее читайте в Условиях использования.
Отказ от ответственности
Информация и публикации не предназначены для предоставления и не являются финансовыми, инвестиционными, торговыми или другими видами советов или рекомендаций, предоставленных или одобренных TradingView. Подробнее читайте в Условиях использования.