
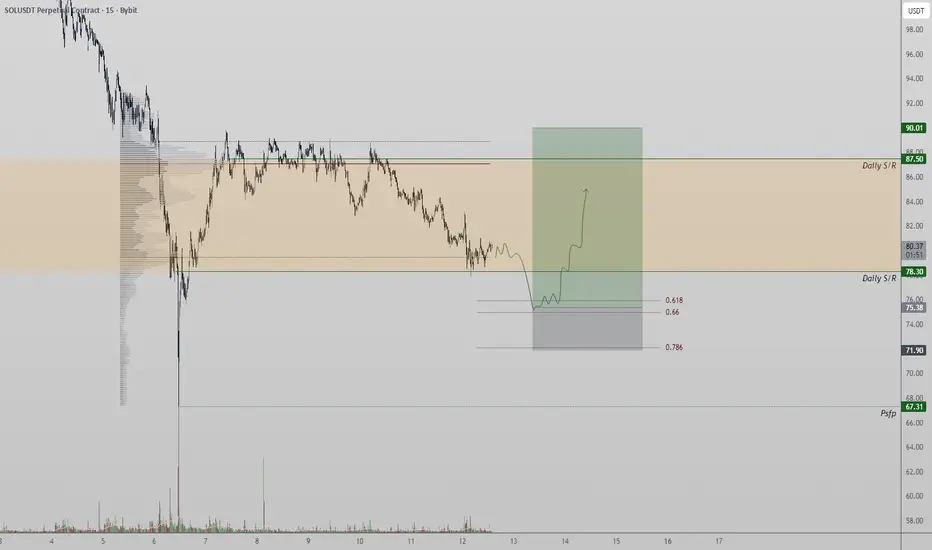
Solana price action is currently bouncing from daily support near the $71 level, an area that aligns closely with the value area low, adding technical significance to the zone. This region has acted as a short-term demand area, allowing price to stabilize after recent downside pressure. However, the rebound so far has lacked strong bullish influxes, suggesting that buyer conviction remains limited.
From a Fibonacci perspective, the lower 0.618 retracement has not yet been tested. In many corrective structures, price often sweeps nearby liquidity before establishing a sustainable bottom. This means Solana could briefly rotate lower to test the 0.618 Fibonacci level, potentially taking out early long positions, before attempting a more meaningful reversal.
Such a move would be consistent with a bottoming process rather than immediate continuation. If price finds acceptance and strong demand at the Fibonacci support, it would increase the probability of a rotational move higher. In that scenario, the next key upside target would be the higher-timeframe resistance near $87.50.
From a technical and price action perspective, Solana is currently trading in a key reversal zone. A successful bottoming structure, supported by improving volume, would be required to confirm a shift in momentum and open the door for upside continuation. Until then, traders should remain cautious and monitor liquidity behavior closely.
From a Fibonacci perspective, the lower 0.618 retracement has not yet been tested. In many corrective structures, price often sweeps nearby liquidity before establishing a sustainable bottom. This means Solana could briefly rotate lower to test the 0.618 Fibonacci level, potentially taking out early long positions, before attempting a more meaningful reversal.
Such a move would be consistent with a bottoming process rather than immediate continuation. If price finds acceptance and strong demand at the Fibonacci support, it would increase the probability of a rotational move higher. In that scenario, the next key upside target would be the higher-timeframe resistance near $87.50.
From a technical and price action perspective, Solana is currently trading in a key reversal zone. A successful bottoming structure, supported by improving volume, would be required to confirm a shift in momentum and open the door for upside continuation. Until then, traders should remain cautious and monitor liquidity behavior closely.

Join the Free Trading Group
Telegram: t.me/freetradingden 🔥
Claim $1000 Deposit Bonus 🎁
Trade with perks & support the community!
partner.blofin.com/d/TheAlchemist
Stay sharp, trade smart.
— Team The Alchemist ⚔️
Telegram: t.me/freetradingden 🔥
Claim $1000 Deposit Bonus 🎁
Trade with perks & support the community!
partner.blofin.com/d/TheAlchemist
Stay sharp, trade smart.
— Team The Alchemist ⚔️
Отказ от ответственности
Информация и публикации не предназначены для предоставления и не являются финансовыми, инвестиционными, торговыми или другими видами советов или рекомендаций, предоставленных или одобренных TradingView. Подробнее читайте в Условиях использования.
Join the Free Trading Group
Telegram: t.me/freetradingden 🔥
Claim $1000 Deposit Bonus 🎁
Trade with perks & support the community!
partner.blofin.com/d/TheAlchemist
Stay sharp, trade smart.
— Team The Alchemist ⚔️
Telegram: t.me/freetradingden 🔥
Claim $1000 Deposit Bonus 🎁
Trade with perks & support the community!
partner.blofin.com/d/TheAlchemist
Stay sharp, trade smart.
— Team The Alchemist ⚔️
Отказ от ответственности
Информация и публикации не предназначены для предоставления и не являются финансовыми, инвестиционными, торговыми или другими видами советов или рекомендаций, предоставленных или одобренных TradingView. Подробнее читайте в Условиях использования.