
SOL is facing one of its most devastating declines since September, and the reasons are clearer than you might think.
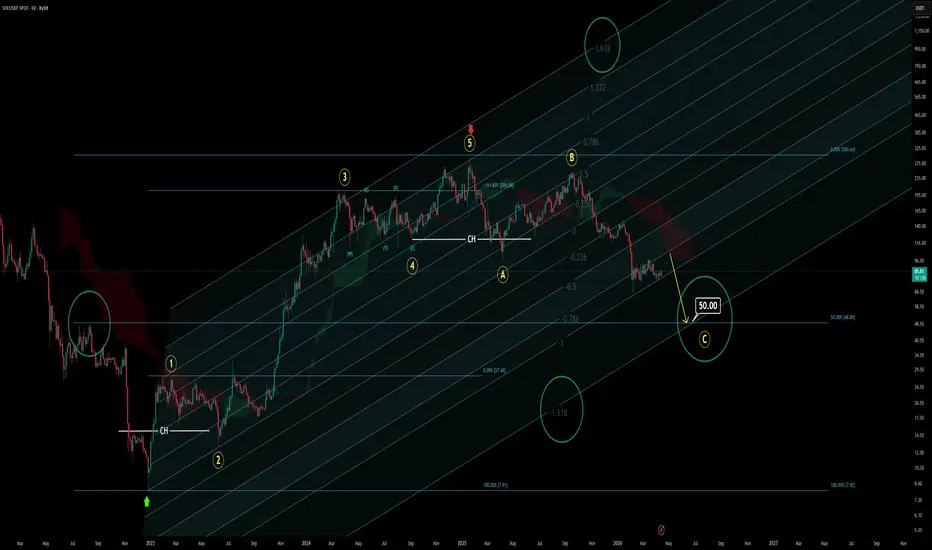
The red arrow on the chart marks where Wave 5 ended. If you examine past movements, a clear pattern emerges. Wave 3 of the bullish phase was far more extended than the market expected. This can be explained by combining Fibonacci channels and ratios. This unexpected extension of Wave 3 was caused by the memecoin hype over the last year. This same extension also caused Wave 5 to end earlier than expected. That is why Solana was unable to reach new all-time highs while Bitcoin did during last year's rally.
For Solana, last year’s rally was a correction. Right before wave B started, a visible change in character appeared on higher time frames. This trapped many traders in short positions because they believed it was time to short.
There are multiple ways to tell a story. For this chart, you could say, "hey, there is a bear flag!" or "a head and shoulders pattern has formed!" Both would be true, just like other methods. The main thing to consider is: what is the target?
What I see at the moment is simple: Solana is in Wave C, and it is actually nearing its end. Use a simple Fibonacci retracement tool and measure from the latest high to the very bottom. You’ll find that the 50% level of this move is close to $50.
Then, use a Fibonacci channel as I do and check where the main impulsive Wave 3 ended. You’ll realize it is extending to 1.618, which will be the same for Wave C. You don’t have to calculate another Fibonacci channel; just go to the settings and type "-1.618". If the Fibonacci retracement's 50% target and the Fibonacci channel's -1.618 target align, well, that is your target for Wave C.
Thanks for reading.
Skyress
The red arrow on the chart marks where Wave 5 ended. If you examine past movements, a clear pattern emerges. Wave 3 of the bullish phase was far more extended than the market expected. This can be explained by combining Fibonacci channels and ratios. This unexpected extension of Wave 3 was caused by the memecoin hype over the last year. This same extension also caused Wave 5 to end earlier than expected. That is why Solana was unable to reach new all-time highs while Bitcoin did during last year's rally.
For Solana, last year’s rally was a correction. Right before wave B started, a visible change in character appeared on higher time frames. This trapped many traders in short positions because they believed it was time to short.
There are multiple ways to tell a story. For this chart, you could say, "hey, there is a bear flag!" or "a head and shoulders pattern has formed!" Both would be true, just like other methods. The main thing to consider is: what is the target?
What I see at the moment is simple: Solana is in Wave C, and it is actually nearing its end. Use a simple Fibonacci retracement tool and measure from the latest high to the very bottom. You’ll find that the 50% level of this move is close to $50.
Then, use a Fibonacci channel as I do and check where the main impulsive Wave 3 ended. You’ll realize it is extending to 1.618, which will be the same for Wave C. You don’t have to calculate another Fibonacci channel; just go to the settings and type "-1.618". If the Fibonacci retracement's 50% target and the Fibonacci channel's -1.618 target align, well, that is your target for Wave C.
Thanks for reading.
Skyress
Сделка активна
It's gonna be a painfull thing to watch but it's ON.
Похожие публикации
Отказ от ответственности
Информация и публикации не предназначены для предоставления и не являются финансовыми, инвестиционными, торговыми или другими видами советов или рекомендаций, предоставленных или одобренных TradingView. Подробнее читайте в Условиях использования.
Похожие публикации
Отказ от ответственности
Информация и публикации не предназначены для предоставления и не являются финансовыми, инвестиционными, торговыми или другими видами советов или рекомендаций, предоставленных или одобренных TradingView. Подробнее читайте в Условиях использования.