
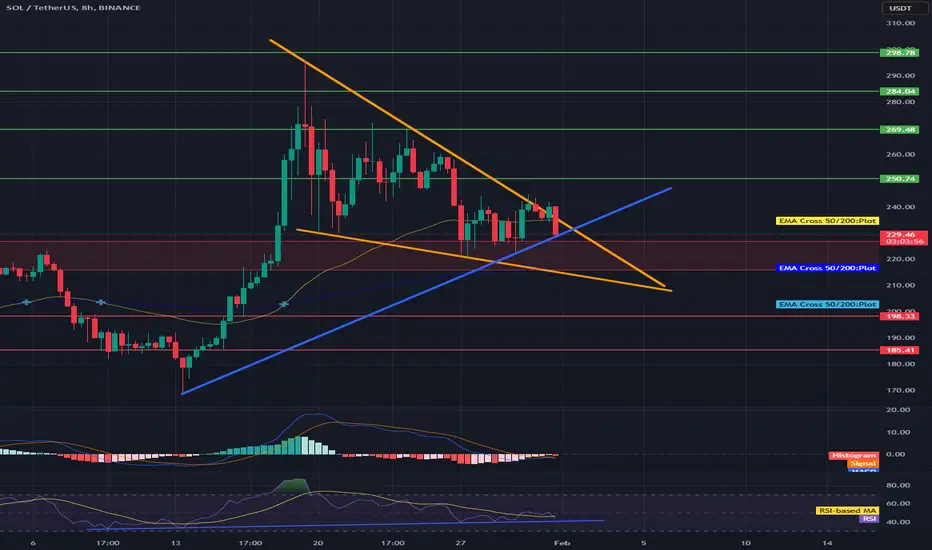
Hi all, let's look at the 8H SOL to USDT chart, in this situation we can see how the price is moving in a downtrend channel, where the potential exit up has been reversed. Here we can also see how the price is based on a specific uptrend line, which is worth watching because breaking it could lower the price even more.
Let's start by defining the targets for the near future that the price must face:
T1 = $250
T2 = $269
Т3 = $284
Т4 = $298
Now let's move on to the stop-loss in case the market continues to fall:
First, we have a strong support zone from $226 to $216 visible, and then we can define two potential stop loss points
SL1 = $198
SL2 = $185
Looking at the MACD indicator, we can see how it shows an attempt to return to the uptrend, which is currently proving ineffective, while on the RSI we are in the lower part with room for a potentially larger rebound.
Let's start by defining the targets for the near future that the price must face:
T1 = $250
T2 = $269
Т3 = $284
Т4 = $298
Now let's move on to the stop-loss in case the market continues to fall:
First, we have a strong support zone from $226 to $216 visible, and then we can define two potential stop loss points
SL1 = $198
SL2 = $185
Looking at the MACD indicator, we can see how it shows an attempt to return to the uptrend, which is currently proving ineffective, while on the RSI we are in the lower part with room for a potentially larger rebound.

Отказ от ответственности
Информация и публикации не предназначены для предоставления и не являются финансовыми, инвестиционными, торговыми или другими видами советов или рекомендаций, предоставленных или одобренных TradingView. Подробнее читайте в Условиях использования.
Отказ от ответственности
Информация и публикации не предназначены для предоставления и не являются финансовыми, инвестиционными, торговыми или другими видами советов или рекомендаций, предоставленных или одобренных TradingView. Подробнее читайте в Условиях использования.