
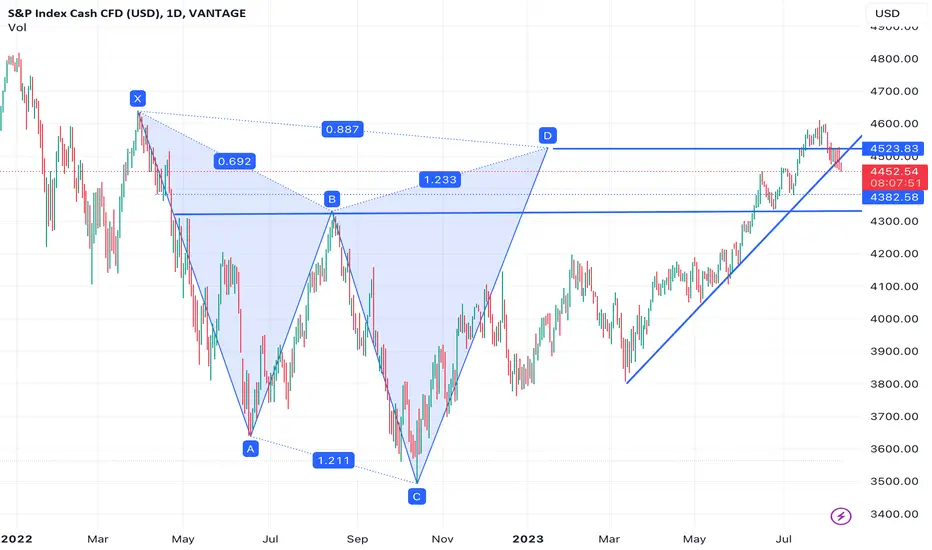
Retrace more than upward trend line. Hold for at least a few days to see outcome.
Cut losses early if unconfident, protect gains when market move in your favour.
Заметка
dropping lower after retest trend line. could short now and stop at the trend line point if you don't mind the risk. otherwise wait for price to break 4443.Заметка
short the pullbackЗаметка
Booooom. protect your gains and take partial profits if you followedЗаметка
partial profit taken at 4340, stop to breakeven and let the rest run.Заметка
short would've entered at 4500 or 4443, let these run. can try long at current level for quick profit. stop at 4324Заметка
long would've played out well depend on how you entered and held. now there's opportunity to add short positions.Заметка
load up the bagЗаметка
both trades stopped at breakeven if you entered as per above. price now in consolidate range.
Отказ от ответственности
Информация и публикации не предназначены для предоставления и не являются финансовыми, инвестиционными, торговыми или другими видами советов или рекомендаций, предоставленных или одобренных TradingView. Подробнее читайте в Условиях использования.
Отказ от ответственности
Информация и публикации не предназначены для предоставления и не являются финансовыми, инвестиционными, торговыми или другими видами советов или рекомендаций, предоставленных или одобренных TradingView. Подробнее читайте в Условиях использования.