
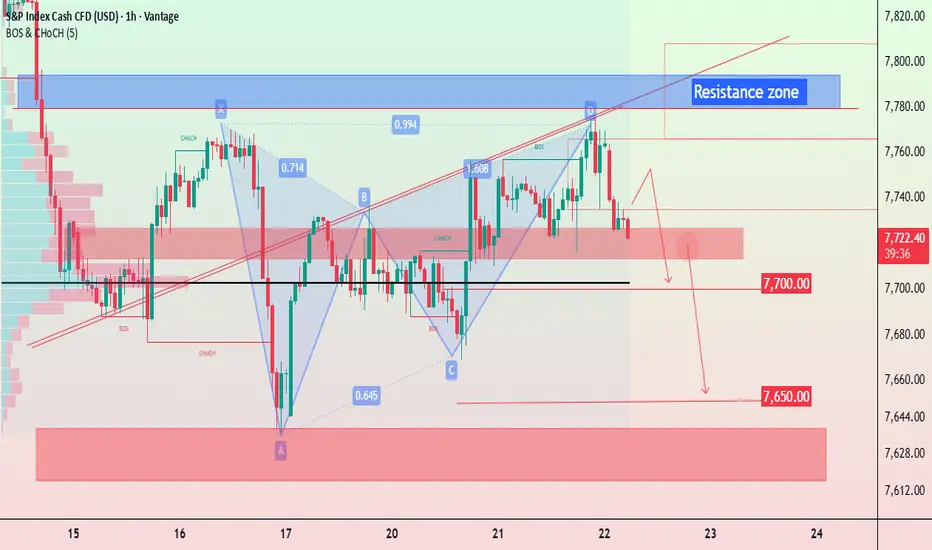
S&P 500 is currently trading around 7,728, showing signs of bearish pressure after facing rejection from the 7,760–7,800 resistance zone. Price is reacting from a potential reversal area, while the bearish Gartley structure suggests sellers may remain active below the key resistance levels.
If bearish momentum continues and price breaks below the 7,700 support area, the index could move toward 7,670 (TP1) and 7,650 (TP2). Further selling pressure may extend the decline toward the lower 7,620–7,610 support zone.
Risk Factor: A recovery above 7,760–7,780 could weaken the bearish setup and trigger a temporary pullback. A sustained breakout above the resistance zone would invalidate the downside scenario and require reassessment.
Market Outlook: S&P 500 remains under selling pressure after rejection from resistance. Watch the 7,700 support closely and look for a confirmed breakdown before considering the next downside move.
💬 What’s your opinion on Gold’s next move? Do you expect a breakout or a rejection? I’d love to hear your market perspective. Let’s share ideas, learn from each other, and grow together as a trading community. 📈💛

👇 DON’T COPY — CLICK THE LINK AND JOIN NOW! 👇
🔗 JOIN OUR FREE TELEGRAM SIGNALS GROUP HERE: 👉 [ t.me/+2y3MsnPCwl5lZDg8 ]
🔗 JOIN OUR FREE TELEGRAM SIGNALS GROUP HERE: 👉 [ t.me/+2y3MsnPCwl5lZDg8 ]
Отказ от ответственности
Информация и публикации не предназначены для предоставления и не являются финансовыми, инвестиционными, торговыми или другими видами советов или рекомендаций, предоставленных или одобренных TradingView. Подробнее читайте в Условиях использования.