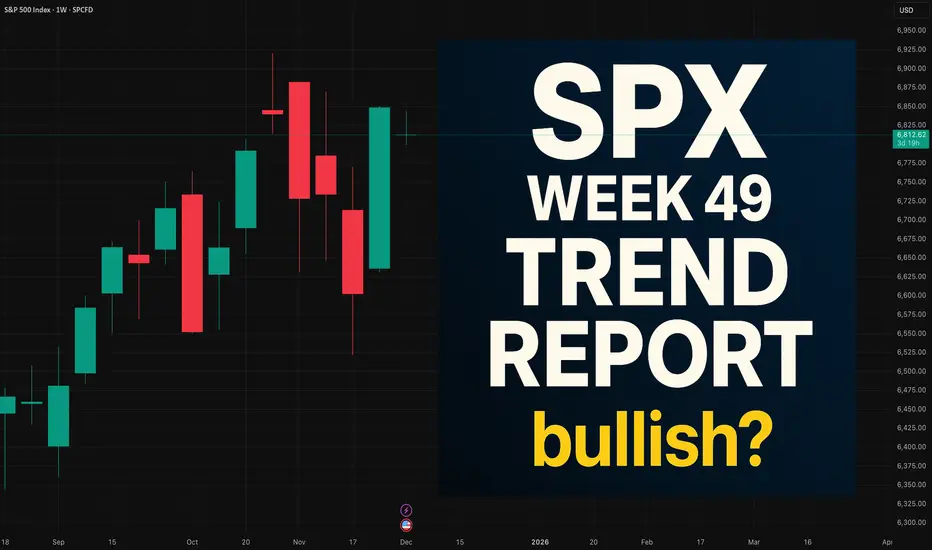
SPX — WEEK 49 TREND REPORT
Ticker: SPX — 12/01/2025 @ 6812.63
Timeframe: WEEKLY
This is a reactive structural classification of SPX based on the weekly chart as of this timestamp. Price conditions are evaluated as they stand — nothing here is predictive or forward-assumptive.
⸻
1) Current Trend Condition
• Trend Duration: +2 weeks (bullish)
• Trend Reversal Level (Origin): 6,721
• Trend Reversal Level (Confirmation): 6,432
⸻
2) Structure Health
Retracement Phase:
• Uptrend (operating above 78.6%)
Position Status:
• Healthy (price above both structural layers)
⸻
3) Temperature: Warming Phase
⸻
4) Momentum: Bullish
⸻
5) Market Sentiment: Bullish
⸻
Author’s Note
This analysis is fully reactive, not predictive. Market conditions, trend structure, and behavior are classified as they appear in real time. The objective is to identify where directional shifts first occurred, where structural integrity remains intact, and where it would begin to weaken if key levels were breached.
Predictive analysis projects outcomes that do not exist yet. Without price confirmation, prediction is built on baseless assumptions. This framework avoids that entirely by responding only to verified structural changes and live conditions.
The levels shown simply identify where the current trend structure first shifted and where it would begin to lose integrity if breached. Recognizing these boundaries allows for clearer interpretation of market behavior without relying on forward guarantees, speculative projections, or unsupported assumptions.
⸻
Methodology Overview
This classification framework evaluates directional conditions using internal trend-interpretation logic that references price behavior relative to its structural layers. These relationships are used to identify when price movement aligns with the framework’s criteria for directional phases, transition points, or regime shifts. Visual elements or structural labels reflect these internal interpretations, rather than explicit trading signals or preset indicator crossovers. This framework is observational only and does not imply future outcomes.
Ticker:
SPX — 12/01/2025 @ 6812.63Timeframe: WEEKLY
This is a reactive structural classification of SPX based on the weekly chart as of this timestamp. Price conditions are evaluated as they stand — nothing here is predictive or forward-assumptive.
⸻
1) Current Trend Condition
• Trend Duration: +2 weeks (bullish)
• Trend Reversal Level (Origin): 6,721
• Trend Reversal Level (Confirmation): 6,432
⸻
2) Structure Health
Retracement Phase:
• Uptrend (operating above 78.6%)
Position Status:
• Healthy (price above both structural layers)
⸻
3) Temperature: Warming Phase
⸻
4) Momentum: Bullish
⸻
5) Market Sentiment: Bullish
⸻
Author’s Note
This analysis is fully reactive, not predictive. Market conditions, trend structure, and behavior are classified as they appear in real time. The objective is to identify where directional shifts first occurred, where structural integrity remains intact, and where it would begin to weaken if key levels were breached.
Predictive analysis projects outcomes that do not exist yet. Without price confirmation, prediction is built on baseless assumptions. This framework avoids that entirely by responding only to verified structural changes and live conditions.
The levels shown simply identify where the current trend structure first shifted and where it would begin to lose integrity if breached. Recognizing these boundaries allows for clearer interpretation of market behavior without relying on forward guarantees, speculative projections, or unsupported assumptions.
⸻
Methodology Overview
This classification framework evaluates directional conditions using internal trend-interpretation logic that references price behavior relative to its structural layers. These relationships are used to identify when price movement aligns with the framework’s criteria for directional phases, transition points, or regime shifts. Visual elements or structural labels reflect these internal interpretations, rather than explicit trading signals or preset indicator crossovers. This framework is observational only and does not imply future outcomes.

Tracking 15 names across SPX, NDX, and DJX leadership with structured weekly market reads and public scorekeeping. For deeper updates, chart posts, and progress tracking, follow my Instagram: @GURULifelineHQ.
Отказ от ответственности
Информация и публикации не предназначены для предоставления и не являются финансовыми, инвестиционными, торговыми или другими видами советов или рекомендаций, предоставленных или одобренных TradingView. Подробнее читайте в Условиях использования.
Tracking 15 names across SPX, NDX, and DJX leadership with structured weekly market reads and public scorekeeping. For deeper updates, chart posts, and progress tracking, follow my Instagram: @GURULifelineHQ.
Отказ от ответственности
Информация и публикации не предназначены для предоставления и не являются финансовыми, инвестиционными, торговыми или другими видами советов или рекомендаций, предоставленных или одобренных TradingView. Подробнее читайте в Условиях использования.