
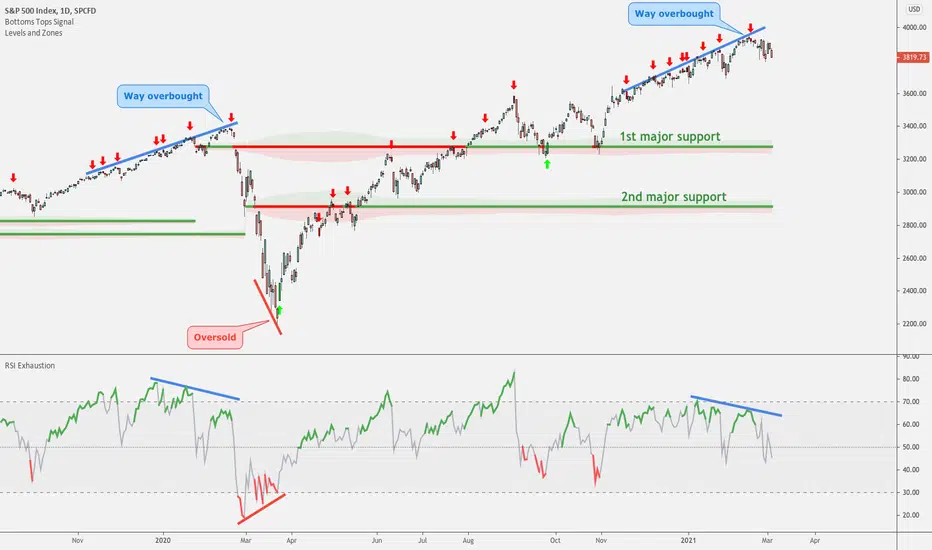
The S&P 500 Index looks extremely overextended and a downward movement is likely going forward.
Currently, the SPX is in a very similar configuration to the pre-pandemic (late 2019 going into early 2020).
Back then the price continued to move higher forming multiple tops while the RSI Exhaustion continued to decrease and stayed mostly bullish exhausted (colored green).
As easily predictable, a significant correction took place later on and continued until late March.
At that point, the chart had completely reversed showing a rather oversold situation and forming a bottom which gave us the opportunity to reenter for a new bull run.
As of today, the SPX is back to a very similar configuration to one year ago: going forward a downward movement is likely.
One final note on the supports. There are two major supports that will sustain the price should it start to fall. However, even the highest support is pretty far away from the current price level so there's plenty of room for triggering a downward movement.
Заметка
Заметка

🔻🔻🔻🔻🔻🔻🔻🔻🔻🔻🔻🔻🔻🔻🔻🔻🔻🔻🔻
🧪 Free Simulators: minimalisttrading.com/tools/
📈 Trading Indicators: minimalisttrading.com
🔺🔺🔺🔺🔺🔺🔺🔺🔺🔺🔺🔺🔺🔺🔺🔺🔺🔺🔺
🧪 Free Simulators: minimalisttrading.com/tools/
📈 Trading Indicators: minimalisttrading.com
🔺🔺🔺🔺🔺🔺🔺🔺🔺🔺🔺🔺🔺🔺🔺🔺🔺🔺🔺
Отказ от ответственности
Информация и публикации не предназначены для предоставления и не являются финансовыми, инвестиционными, торговыми или другими видами советов или рекомендаций, предоставленных или одобренных TradingView. Подробнее читайте в Условиях использования.