
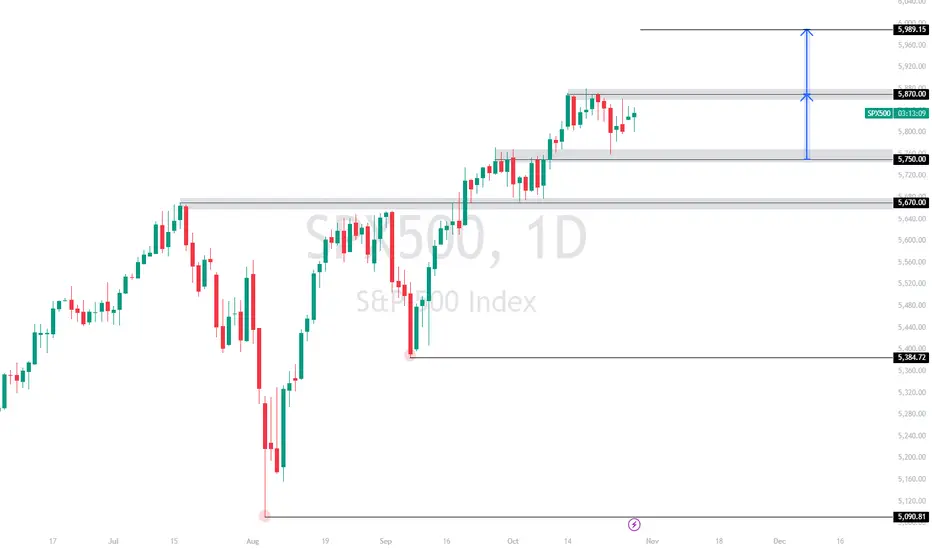
TREND; The S&P 500 index is currently in an uptrend (Bullish), characterized by higher highs and higher lows since mid-August.
PLAN:
• The support zone around 5,670 acted as a base for a recent upward move.
• The 5,870 level seems to be a key resistance area, and price is currently testing this level.
• If the price breaks above the 5,870 resistance level, my potential target will be around 5,989.15.
• Note that the blue arrow indicates the measured move from the support level at 5,750 up to the resistance at 5,870, which could imply the projected target if this breakout occurs.
PLAN:
• The support zone around 5,670 acted as a base for a recent upward move.
• The 5,870 level seems to be a key resistance area, and price is currently testing this level.
• If the price breaks above the 5,870 resistance level, my potential target will be around 5,989.15.
• Note that the blue arrow indicates the measured move from the support level at 5,750 up to the resistance at 5,870, which could imply the projected target if this breakout occurs.

Отказ от ответственности
Информация и публикации не предназначены для предоставления и не являются финансовыми, инвестиционными, торговыми или другими видами советов или рекомендаций, предоставленных или одобренных TradingView. Подробнее читайте в Условиях использования.
Отказ от ответственности
Информация и публикации не предназначены для предоставления и не являются финансовыми, инвестиционными, торговыми или другими видами советов или рекомендаций, предоставленных или одобренных TradingView. Подробнее читайте в Условиях использования.