
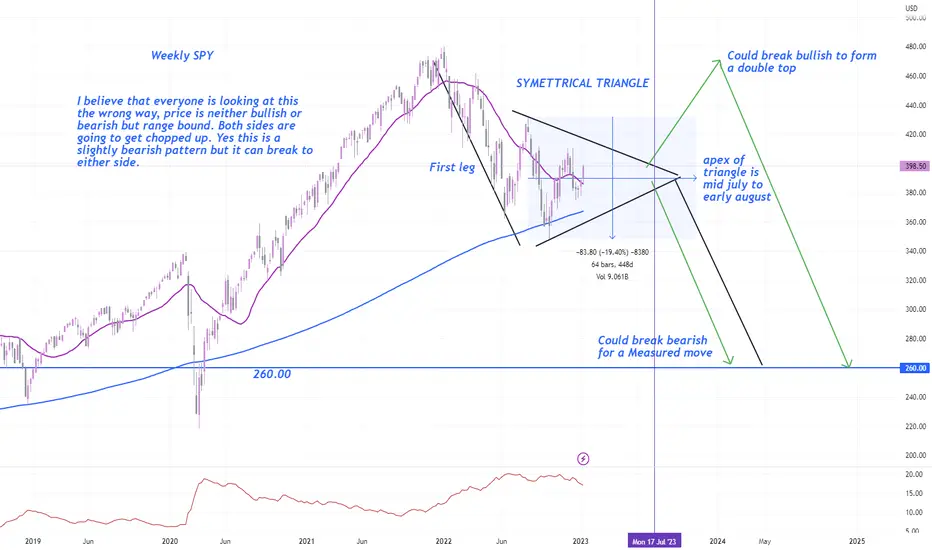
I would like to propose a view on the market that I do not see anybody talking about and that is a range bound symmetrical triangle on the daily. Because price is now range bound, I expect price to be choppy and random. Will be harder to determine the direction. I still have a bearish bias and think SPY is headed to 260 minimum.
Out of the break out, price can retest 480 to form a double top for the real dump or as a continuation of the bearish move back to 260.
Out of the break out, price can retest 480 to form a double top for the real dump or as a continuation of the bearish move back to 260.
Заметка
The monthly chart of the SPY is telling me of a bearish continuation to 260 or a double top to 480. You can't have a bull run for 15 years without a major correction. Заметка
The down trend line is no longer valid and has since evolved into a triangleЗаметка
On the Russell 2000, we have a down channel with price under a curling 21sma monthly average. That also coincides with the SPY with its slight bounce before a dropЗаметка
Russel 2000 on the weekly is going to be slamming into some major resistance overhead with the supply zone, monthly 21sma, downtrend channel top.Заметка
Russel 2000 on the Daily Chart shows more detailЗаметка
DOW JONES is showing a double top formation before a major correctionЗаметка
DOWN JONES DAILY CHARTFiner detail of the impeding 44% correction in possible July

Отказ от ответственности
Информация и публикации не предназначены для предоставления и не являются финансовыми, инвестиционными, торговыми или другими видами советов или рекомендаций, предоставленных или одобренных TradingView. Подробнее читайте в Условиях использования.
Отказ от ответственности
Информация и публикации не предназначены для предоставления и не являются финансовыми, инвестиционными, торговыми или другими видами советов или рекомендаций, предоставленных или одобренных TradingView. Подробнее читайте в Условиях использования.