Hello, traders! 👋 Welcome to another technical analysis. Today, we're taking a closer look at SPY.

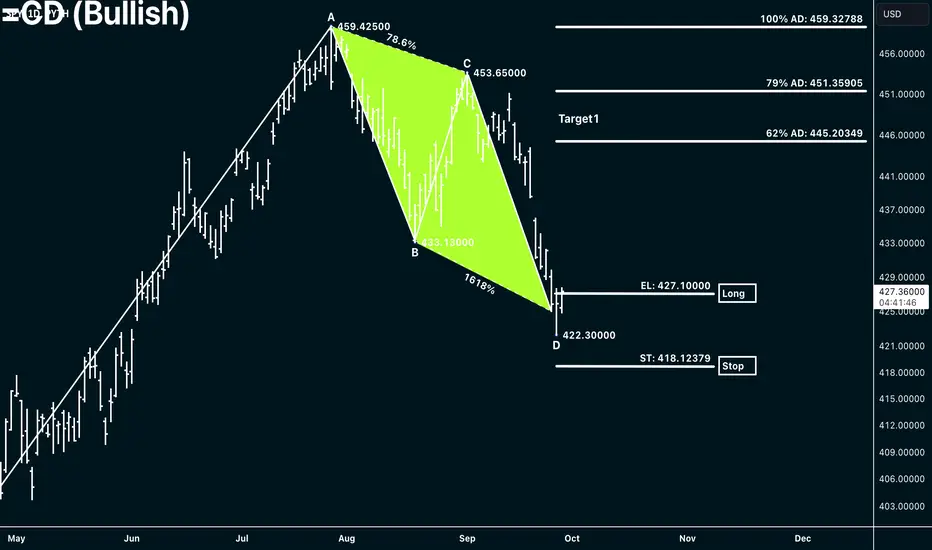
The chart illustrates a symmetry AB=CD pattern, which appears to be bullish on its daily chart. The price has reached an important support level at "D" 422.30000.
The strategy is straightforward: we will buy above the entry level (EL) at 427.10000 with a confirmed upward trend. Our stop-loss will be placed below the cluster zones at ST: 418.12379.
Our target levels will be as follows:
First target at 62% of AD: 445.20349- 79% of AD: 451.35905
Second target at 127% of AD: 469.70833-162% of AD: 482.52695
If you find this analysis interesting and useful, please show your support by liking and following. Stay tuned for more analyses like this one!
The chart illustrates a symmetry AB=CD pattern, which appears to be bullish on its daily chart. The price has reached an important support level at "D" 422.30000.
The strategy is straightforward: we will buy above the entry level (EL) at 427.10000 with a confirmed upward trend. Our stop-loss will be placed below the cluster zones at ST: 418.12379.
Our target levels will be as follows:
First target at 62% of AD: 445.20349- 79% of AD: 451.35905
Second target at 127% of AD: 469.70833-162% of AD: 482.52695
If you find this analysis interesting and useful, please show your support by liking and following. Stay tuned for more analyses like this one!
Заметка

Отказ от ответственности
Информация и публикации не предназначены для предоставления и не являются финансовыми, инвестиционными, торговыми или другими видами советов или рекомендаций, предоставленных или одобренных TradingView. Подробнее читайте в Условиях использования.
Отказ от ответственности
Информация и публикации не предназначены для предоставления и не являются финансовыми, инвестиционными, торговыми или другими видами советов или рекомендаций, предоставленных или одобренных TradingView. Подробнее читайте в Условиях использования.