
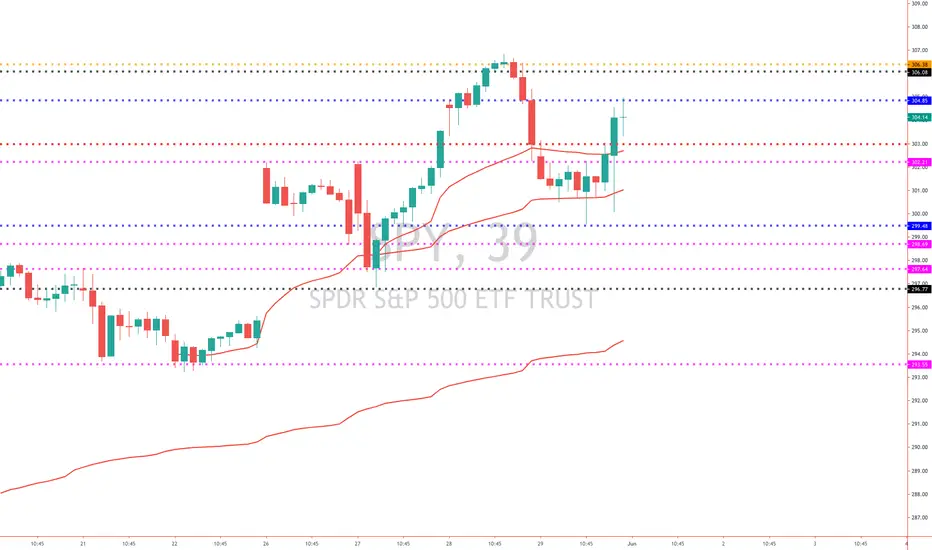
Spy Levels for the week .
Anchor Vwap to see potential key support
Anchor Vwap to see potential key support
Заметка
Black lines - represent last week high and lowBlue lines - respresent previous day high and low
purple line- represents supports and resistance
yellow lines- represents last month high and low
Red indicator represents anchor vwap from previous lows and high. this also works as potential support to watch

Отказ от ответственности
Информация и публикации не предназначены для предоставления и не являются финансовыми, инвестиционными, торговыми или другими видами советов или рекомендаций, предоставленных или одобренных TradingView. Подробнее читайте в Условиях использования.
Отказ от ответственности
Информация и публикации не предназначены для предоставления и не являются финансовыми, инвестиционными, торговыми или другими видами советов или рекомендаций, предоставленных или одобренных TradingView. Подробнее читайте в Условиях использования.