
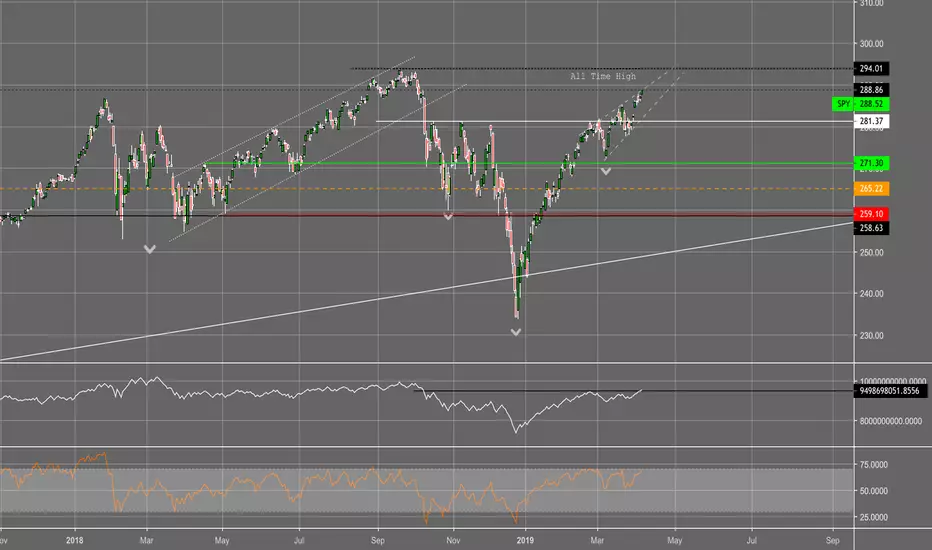
Strong rising wedge for the S&P. Could this take a healthy fall back down...RSI implies it is overbought
Also we had a parabolic move up from the lows of December/Jan...with no real healthy moves down for a recovery period on the way back up
Hypothesis: price reaches near ATH to fail at resistant levels. If it price proves to move back down, I think it could make a W shaped pattern before a move back up or complete a right shoulder for a inverse head and shoulders pattern.
Also we had a parabolic move up from the lows of December/Jan...with no real healthy moves down for a recovery period on the way back up
Hypothesis: price reaches near ATH to fail at resistant levels. If it price proves to move back down, I think it could make a W shaped pattern before a move back up or complete a right shoulder for a inverse head and shoulders pattern.
Сделка активна
The S&P has now fallen out of the rising wedge and has accomplished target 1
Отказ от ответственности
Информация и публикации не предназначены для предоставления и не являются финансовыми, инвестиционными, торговыми или другими видами советов или рекомендаций, предоставленных или одобренных TradingView. Подробнее читайте в Условиях использования.
Отказ от ответственности
Информация и публикации не предназначены для предоставления и не являются финансовыми, инвестиционными, торговыми или другими видами советов или рекомендаций, предоставленных или одобренных TradingView. Подробнее читайте в Условиях использования.